
Page 42 - The Master Handbook Of Acoustics
P. 42
17
FUNDAMENTALS OF SOUND
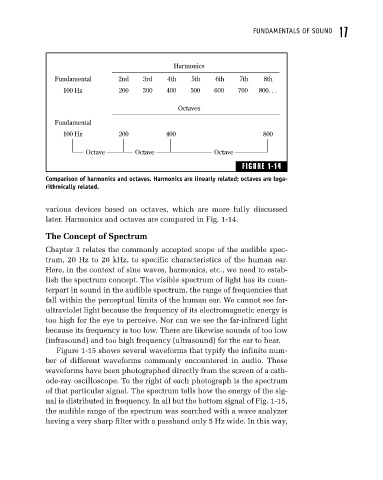
Harmonics
Fundamental 2nd 3rd 4th 5th 6th 7th 8th
100 Hz 200 300 400 500 600 700 800. . .
Octaves
Fundamental
100 Hz 200 400 800
Octave Octave Octave
FIGURE 1-14
Comparison of harmonics and octaves. Harmonics are linearly related; octaves are loga-
rithmically related.
various devices based on octaves, which are more fully discussed
later. Harmonics and octaves are compared in Fig. 1-14.
The Concept of Spectrum
Chapter 3 relates the commonly accepted scope of the audible spec-
trum, 20 Hz to 20 kHz, to specific characteristics of the human ear.
Here, in the context of sine waves, harmonics, etc., we need to estab-
lish the spectrum concept. The visible spectrum of light has its coun-
terpart in sound in the audible spectrum, the range of frequencies that
fall within the perceptual limits of the human ear. We cannot see far-
ultraviolet light because the frequency of its electromagnetic energy is
too high for the eye to perceive. Nor can we see the far-infrared light
because its frequency is too low. There are likewise sounds of too low
(infrasound) and too high frequency (ultrasound) for the ear to hear.
Figure 1-15 shows several waveforms that typify the infinite num-
ber of different waveforms commonly encountered in audio. These
waveforms have been photographed directly from the screen of a cath-
ode-ray oscilloscope. To the right of each photograph is the spectrum
of that particular signal. The spectrum tells how the energy of the sig-
nal is distributed in frequency. In all but the bottom signal of Fig. 1-15,
the audible range of the spectrum was searched with a wave analyzer
having a very sharp filter with a passband only 5 Hz wide. In this way,