
Page 155 - The Petroleum System From Source to Trap
P. 155
148 Jordan and Wilson
M w p G B D 18
p
A 16
�--------- WP� )
M 14
A
A � 12
CJ)
@ill y 0
a:
0 10
l ( ) s a..
w
E (!)
<
a:
c w
>
0 <
��----�� BA cjl ''-----,
( -------------------� N
(� __ B_C_<P ... _ __,) � D
A
A
TIDAL SHOALS R SLOPE BASINAL
�-----------� y FlATS E DEPOSITS
E
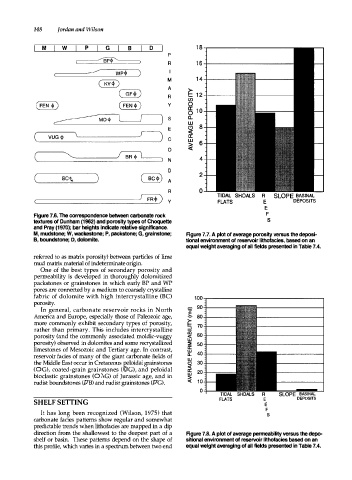
Figure 7.6. The correspondence between carbonate rock F
textures of Dunham (1962) and porosity types of Choquette s
and Pray (1970); bar heights indicate relative significance.
M, mudstone; W, wackestone; P, packstone; G, grainstone; Figure 7.7. A plot of average porosity versus the deposi
B, boundstone; D, dolomite. tional environment of reservoir lithofacies, based on an
equal weight averaging of all fields presented in Table 7.4.
referred to as matrix porosity) between particles of lime
mud matrix material of indeterminate origin.
One of the best types of secondary porosity and
permeability is developed in thoroughly dolomitized
packstones or grainstones in which early BP and WP
pores are connected by a medium to coarsely crystalline
fabric of dolomite with high intercrystalline (BC) 100
porosity.
In general, carbonate reservoir rocks in North <o 90
America and Europe, especially those of Paleozoic age, .s 80
more commonly exhibit secondary types of porosity,
� 70
rather than primary. This includes intercrystalline ..J
co
porosity (and the commonly associated moldic-vuggy <( 60
w
porosity) observed in dolomites and some recrystallized ::!: 50
limestones of Mesozoic and Tertiary age. In contrast, a:
w
reservoir facies of many of the giant carbonate fields of a.. 40
w
the Middle East occur in Cretaceous eeloidal grainstones 0 30
(OG), coated-grain grainstones (@G), and peloidal <( 20
a:
bioclastic grainstones (O),G) of Jurassic age, and in w
>
rudist boundstones (.l7B) and rudist grainstones (.l7G). <( 10
0
DEPOSITS
SHELF SETTING
It has long been recognized (Wilson, 1975) that
carbonate facies patterns show regular and somewhat
predictable trends when lithofacies are mapped in a dip
direction from the shallowest to the deepest part of a Figure 7.8. A plot of average permeability versus the depo
shelf or basin. These patterns depend on the shape of sitional environment of reservoir lithofacies based on an
this profile, which varies in a spect between two end equal weight averaging of all fields presented in Table 7.4.