
Page 184 - The Petroleum System From Source to Trap
P. 184
176 Deming
� k, ) k,
........ .
G �E
.
0 ......
� .
Q) +'"� 3:
... k,< k,
:::l 5
'lii . . . Time
'= ·
Q) . + �
0
c. u:::: sediment
E .c.
� 1ii " 15.
<II
Q) 0
(ij J: , / basement
:::l I
c::
c:: '\ s edimentation ceases
c(
c: 0
<'II 0 20 40
Q) 60 80 100
::::!
Time 1 0 6 yr)
(
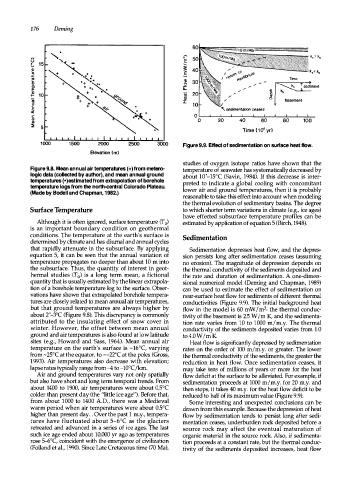
1000 2000 3000 Figure 9.9. Effect of sedimentation on surface heat flow.
Elevation (m)
studies of oxygen isotope ratios have shown that the
Figure 9.8. Mean annual air temperatures (+) from rnetero temperature of seawater has systematically decreased by
logic data (collected by author), and mean annual ground about 10°-15°C (Savin, 1984). If this decrease is inter
temperatures {•) estimated from extrapolation of borehole preted to indicate a global cooling with concomitant
te mperature logs from the north-central Colorado Plateau. lower air and ground temperatures, then it is probably
(Made by Bodell and Chapman, 1982.)
reasonable to take this effect into account when modeling
the thermal evolution of sedimentary basins. The degree
Surface T e mperature to which shorter term variations in climate (e.g., ice ages)
have effected subsurface temperature profiles can be
Although it is often ignored, surface temperature (T0) estimated by application of equation 5 (Birch, 1948).
is an important boundary condition on geothermal
conditions. The temperature at the earth's surface is Sedimentation
determined by climate and has diurnal and annual cycles
that rapidly attenuate in the subsurface. By applying Sedimentation depresses heat flow, and the depres
equation 5, it can be seen that the annual variation of sion persists long after sedimentation ceases (assuming
temperature propagates no deeper than about 10 m into no erosion). The magnitude of depression depends on
the subsurface. Thus, the quantity of interest in geot the thermal conductivity of the sediments deposited and
hermal studies (T 0) is a long term mean, a fictional the rate and duration of sedimentation. A one-dimen
quantity that is usually estimated by the linear extrapola sional numerical model (Deming and Chapman, 1989)
tion of a borehole temperature log to the surface. Obser can be used to estimate the effect of sedimentation on
vations have shown that extrapolated borehole tempera near-surface heat flow for sediments of different thermal
tures are closely related to mean annual air temperatures, conductivities (Figure 9.9). The initial background heat
but that ground temperatures are always higher by flow in the model is 60 mW /m2, the thermal conduc
about 2°-3°C (Figure 9.8). This discrepancy is commonly tivity of the basement is 2.5 W /m K, and the sedimenta
attributed to the insulating effect of snow cover in tion rate varies from 10 to 1000 m/m.y. The thermal
winter. However, the offset between mean annual conductivity of the sediments deposited varies from 1.0
ground and air temperatures is also found at low latitude to 4.0 W/m K.
sites (e.g., Howard and Sass, 1964). Mean annual air Heat flow is signifcantly depressed by sedimentation
temperature on the earth's surface is -16°C, varying rates on the order of 100 m/m.y. or greater. The lower
from -25°C at the equator, to --22°C at the poles (Gross, the thermal conductivity of the sediments, the greater the
1 9 93). Air temperatures also decrease with elevation; reduction in heat flow. Once sedimentation ceases, it
lapse rates typically range from -4 to -10°C/km. may take tens of millions of years or more for the heat
Air and ground temperatures vary not only spatially flow deficit at the surface to be alleviated. For example, if
but also have short and long term temporal trends. From sedimentation proceeds at 1000 m/m.y. for 20 m.y. and
about 1400 to 1900, air temperatures were about o.soc then stops, it takes 40 m.y. for the heat flow deficit to be
colder than present day (the "little ice age"). Before that, reduced to half of its maximum value (Figure 9.9).
from about 1 0 00 to 1400 A.D., there was a Medieval Some interesting and unexpected conclusions can be
warm period when air temperatures were about 0.5°C drawn from this example. Because the depression of heat
higher than present day . Over the past 1 m.y., tempera flow by sedimentation tends to persist long after sedi
.
tures have fluctuated about 5-6°C as the glaciers mentation ceases, underburden rock deposited before a
retreated and advanced in a series of ice ages. The last source rock may affect the eventual maturation of
such ice age ended about 10,000 yr ago as temperatures organic material in the source rock. Also, if sedimenta
rose 5--6°C, coincident with the emergence of civilization tion proceeds at a constant rate, but the thermal conduc
(Folland et al., 1990). Since Late Cretaceous time (70 Ma), tivity of the sediments deposited increases, heat flow