
Page 181 - The Petroleum System From Source to Trap
P. 181
9. Overburden Rock, Temperature, and Heat Flow 1 7 3
( a )
1 0 0
F��HINKPJ
ATI
8 0
1- -- -
-
60 T ! �
- - - -r-.l _ NIN I ETK DRP
-
40 - KOL I
- - - --r--- SBE IKP
20
LBN
0
A (b)
A '
SOH ETK JWD
SBE KOL IN! NIN FCK NKP ATI DRP
0
E 2
.:r.
-
- -
Qi - so --.:..:7T
> 3 -
2 - --
tO
Q)
rtl
:1: - -- -
0
Q) 5
.0
.c
Q. 6
(I)
Cl 50 k m
7
8
'•.,
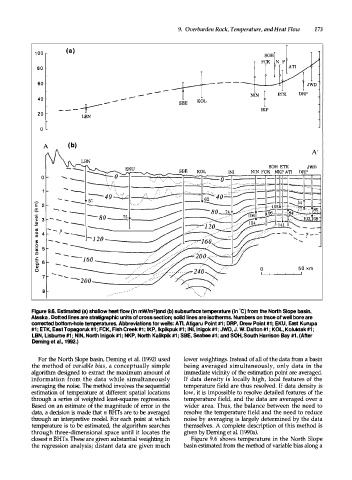
Figure 9.6. Estimated (a) shallow heat flow (in mW/m2)and (b) subsurface temperature (in "C) from the North Slope basin,
Alaska . Dotted lines are stratigraphic units of cross section; solid lines are isotherms. Numbers on trace of well bore are
correced bottom-hole temperatures. Abbreviations for wells: An, Atigaru Point #1; DRP, Drew Point #1; EKU, East Kurupa
#1; ETK, East Topagoruk #1; FCK, Fish Creek #1 ; IKP, lkpikpuk #1; INI, lnigok #1 ; JWD, J. W. Dalton #1 ; KOL, Koluktak #1 ;
LBN, Lisburne #1 ; NIN, North lnigok #1; NKP, North Kalikpik #1 ; SBE, Seabee #1 ; and SOH, South Harrison Bay #1. (After
Deming et al., 1992.)
For the North Slope basin, Deming et al. (1992) used lower weightings. Instead of all of the data from a basin
the method of variable bias, a conceptually simple being averaged simultaneously, only data in the
algorithm designed to extract the maximum amount of immediate vicinity of the estimation point are averaged.
information from the data while simultaneously If data density is locally high, local features of the
averaging the noise. The method involves the sequential temperature field are thus resolved. If data density is
estimation of temperature at different spatial locations low, it is impossible to resolve detailed features of the
through a series of weighted least-squares regressions. temperature field, and the data are averaged over a
Based on an estimate of the magnitude of error in the wider area. Thus, the balance between the need to
data, a decision is made that n BHTs are to be averaged resolve the temperature field and the need to reduce
through an interpretive model. For each point at which noise by averaging is largely determined by the data
temperature is to be estimated, the algorithm searches themselves. A complete description of this method is
through three-dimensional space until it locates the given by Deming et al. (1990a).
closest n BHTs. These are given substantial weighting in Figure 9.6 shows temperature in the North Slope
the regression analysis; distant data are given much basin estimated from the method of variable bias along a