
Page 84 - The Petroleum System From Source to Trap
P. 84
76 Demaison and Huizinga
response), as measured by Rock-Eva! pyrolysis on well
cuttings, core, and outcrop samples. The pod of mature
source rock is delineated by projecting thermal maturity
data from key wells onto seismic depth maps and/ or by
using kinetic mcxieling methods. Following these delin
eations, the volumes of mature source rock can be
estimated with the assistance of geochemical, strati
graphic, and seismic information. Finally, a gross
approximation of the amount of petroleum generated in
the pod of mature source rock can be obtained using
genetic potentials (in kg HC/t rock), mature source rock
volumes, source rock densities, and thermal maturity
conversion factors (e.g., modeled transformation ratios).
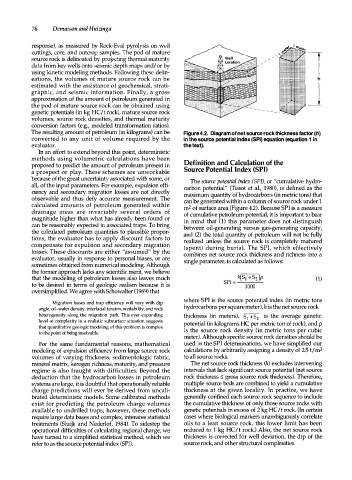
The resulting amount of petroleum (in kilograms) can be Figure 4.2. Diagram of net source rock thickness factor (h)
converted to any unit of volume required by the in the source potential index (SPI) equation (equation 1 in
evaluator. the text).
In an effort to extend beyond this point, deterministic
methods using volumetric calculations have been
proposed to predict the amount of petroleum present in Definition and Calculation of the
a prospect or play. These schemes are unworkable Source Potential Index (SPI)
because of the great uncertainty associated with some, or The source potential index (SPI), or "cumulative hydro
all, of the input parameters. For example, expulsion effi carbon potential" (Tissot et al., 1980), is defined as the
ciency and secondary migration losses are not directly maximum quantity of hydrocarbons (in metric tons) that
observable and thus defy accurate measurement. The can be generated within a column of source rock under 1
calculated amounts of petroleum generated within m2 of surface area (Figure 4.2). Because SPI is a measure
drainage areas are invariably several orders of of cumulative petroleum potential, it is important to bear
magnitude higher than what has already been found or in mind that (1) this parameter does not distinguish
can be reasonably expected in associated traps. To bring between oil-generating versus gas-generating capacity,
the calculated petroleum quantities to plausible propor and (2) the total quantity of petroleum will not be fully
tions, the evaluator has to apply discount factors to realized unless the source rock is completely matured
compensate for expulsion and secondary migration (spent) during burial. The SPI, which effectively
losses. These discounts are either "assumed" by the combines net source rock thickness and richness into a
evaluator, usually in response to personal biases, or are single parameter, is calculated as follows:
sometimes obtained from numerical modeling. Although
the former approach lacks any scientific merit, we believe
that the modeling of petroleum losses also leaves much h(S1 + S z)P (1)
�
to be desired in terms of geologic realism because it is SPI = � - 1000 -
oversimplified. We agree with Schowalter (1989) that
where SPI is the source potential index (in metric tons
Migration losses and trap efficiency will vary with dip
angle, oil-water density, interfacial tension, wettability, and rock hydrocarbons per square meter), h i s the net source rock
heterogeneity along the migration path. This ever expanding thickness (in meters), s + s 2 is the average genetic
1
level of complexity in a realistic subsurface situation suggests
potential (in kilograms HC per metric ton of rock), and p
that quantitative geologic modeling of this problem is complex is the source rock density (in metric tons per cubic
to the point of being insolvable.
meter). Although specific source rock densities should be
For the same fundamental reasons, mathematical used in the SPI determinations, we have simplified our
modeling of expulsion efficiency from large source rock calculations by arbitrarily assigning a density of 2.5 t/m3
volumes of varying thickness, sedimentologic fabric, to all source rocks.
mineral matrix, kerogen richness, maturity, and pressure The net source rock thickness (h) excludes intervening
regime is also fraught with difficulties. Beyond the intervals that lack significant source potential (net source
deduction that the hydrocarbon losses in petroleum rock thickness � gross source rock thickness). Therefore,
systems are large, it is doubtful that operationally reliable multiple source beds are combined to yield a cumulative
charge predictions will ever be derived from uncali thickness at the given locality. In practice, we have
brated deterministic models. Some calibrated methods generally confined each source rock sequence to include
exist for predicting the petroleum charge volumes the cumulative thickness of only those source rocks with
available to undrilled traps; however, these methods genetic potentials in excess of 2 kg HC/t rock. (In certain
require large data bases and complex, intensive statistical cases where biological markers unambiguously correlate
treatments (Sluijk and Nederlof, 1984). To sidestep the oils to a lean source rock, this lower limit has been
operational difficulties of calculating regional charge, we reduced to 1 kg HC/ t rock.) Also, the net source rock
have turned to a simplified statistical method, which we thickness is corrected for well deviation, the dip of the
refer to as the source potential index (SPI). source rock, and other structural complexities.