
Page 375 - The Toyota Way Fieldbook
P. 375
Chapter 15. Complete a Thorough Root Cause Analysis 349
Distill Root Cause Analysis to Simplest Terms
Note that any problem has many possible causes, and therefore many root causes.
Attempting to list them all using the Five-Why causal chain would be tedious
and time consuming. Though it’s important to understand the thought process
and the flow-through to the root cause level, for the sake of focusing efforts, it’s
better to return to the beginning and place real values on each cause along the
chain, effectively isolating the most significant issues and providing tangible
data that will indicate the degree of improvement possible.
A key to the Toyota process is the ability to be extremely concise in presenting
massive amounts of information. Employees can then cut through the informa-
tion available and communicate simply and clearly in a way that is understood
by everyone. The Toyota Way forces the distillation of the information to only
the most relevant details. It is always an important part of the process to review
information with superiors, subordinates, and peers so guidance and support
may be given. Providing reams of information that have to be interpreted or read
by many individuals is considered a disservice to the readers. Imagine the waste
if 10 or 20 people each had to read all the information and sift through the data
to reach the appropriate conclusions!
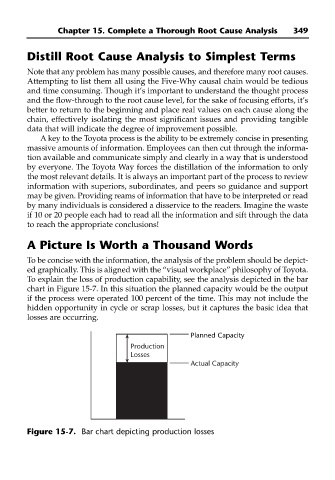
A Picture Is Worth a Thousand Words
To be concise with the information, the analysis of the problem should be depict-
ed graphically. This is aligned with the “visual workplace” philosophy of Toyota.
To explain the loss of production capability, see the analysis depicted in the bar
chart in Figure 15-7. In this situation the planned capacity would be the output
if the process were operated 100 percent of the time. This may not include the
hidden opportunity in cycle or scrap losses, but it captures the basic idea that
losses are occurring.
Planned Capacity
Production
Losses
Actual Capacity
Figure 15-7. Bar chart depicting production losses