
Page 376 - The Toyota Way Fieldbook
P. 376
350 THE TOYOTA WAY FIELDBOOK
Production Losses by Category
80 75
70
60
60
Minutes per Shift 50
40
30
20
20
10
0
Cycle Run Time Scrap
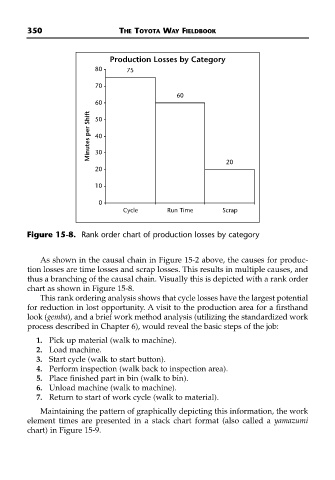
Figure 15-8. Rank order chart of production losses by category
As shown in the causal chain in Figure 15-2 above, the causes for produc-
tion losses are time losses and scrap losses. This results in multiple causes, and
thus a branching of the causal chain. Visually this is depicted with a rank order
chart as shown in Figure 15-8.
This rank ordering analysis shows that cycle losses have the largest potential
for reduction in lost opportunity. A visit to the production area for a firsthand
look (gemba), and a brief work method analysis (utilizing the standardized work
process described in Chapter 6), would reveal the basic steps of the job:
1. Pick up material (walk to machine).
2. Load machine.
3. Start cycle (walk to start button).
4. Perform inspection (walk back to inspection area).
5. Place finished part in bin (walk to bin).
6. Unload machine (walk to machine).
7. Return to start of work cycle (walk to material).
Maintaining the pattern of graphically depicting this information, the work
element times are presented in a stack chart format (also called a yamazumi
chart) in Figure 15-9.