Page 115 - The engineering of chemical reactions
P. 115

The  l/r  Plot  99

                             positive order kinetics, and the difference becomes larger as the order of the reaction
                             increases. For zeroth order kinetics the sizes required for a given conversion are exactly
                             equal, and for negative order kinetics the CSTR requires a smaller volume than a  PFTR
                             (or batch reactor). We will show later that this is not necessarily true in a nonisothermal
                             reactor, where the CSTR can “win” over the PFTR in both simplicity and residence time.

            THE l/r PLOT


                             There is a graphical construction that shows the difference of residence times in different
                             types and combinations of chemical reactors. We write the mass balance equations as
                                                       CAo  -  CA
                                                TCSTR  =        =  &(CAo   -  CA)
                                                         r(cA)
                             and
                                                                CA
                                                                    1
                                                      TPlTR  =  -  ~  dCA
                                                               s r(cA)
                                                              CA0
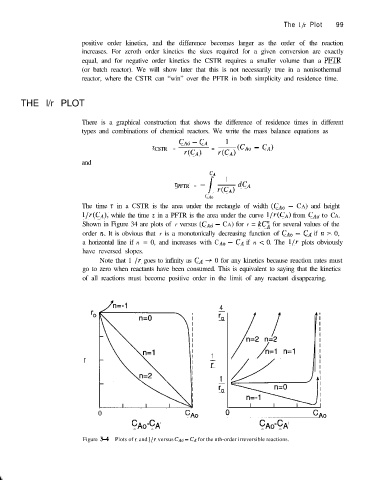
                             The time  t  in a CSTR is the area under the rectangle of width  (CAM   -  CA) and height
                             l/r(CA),  while the time t  in a PFTR is the area under the curve l/r(CA)  from  CA,,  to CA.
                             Shown in Figure 34 are plots of r  versus  (C,J~ -  CA) for  r  = kC2 for several values of the
                             order  n.  It is obvious that r  is a monotonically decreasing function of  CA,,   -  CA  if IZ  >  0,
                             a horizontal line if  n  = 0, and increases with CA0 -  CA  if n  <  0. The l/r  plots obviously
                             have reversed slopes.
                                  Note that 1 /r  goes to infinity as CA  +  0 for any kinetics because reaction rates must
                             go to zero when reactants have been consumed. This is equivalent to saying that the kinetics
                             of all reactions must become positive order in the limit of any reactant disappearing.


                                                                  4
                                                                  To

                                                                1 //;/              n=l
                                                                              n=2

                             r
                                                                r

                                                                  1
                                                                  ro


                                 0                       cAo

                                          CAo’CA                             CA&A
                             Figure  3-4  Plots of I and l/r versus CA,, - C, for the nth-order irreversible reactions.
   110   111   112   113   114   115   116   117   118   119   120