
Page 93 - The engineering of chemical reactions
P. 93
Reaction-Rate Data 77
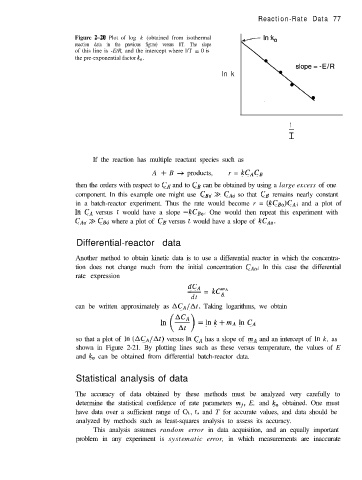
Figure 2-20 Plot of log k (obtained from isothermal
reaction data in the previous figure) versus l/T. The slope
of this line is -E/R, and the intercept where l/T = 0 is
the pre-exponential factor k,,.
In k
1
T
If the reaction has multiple reactant species such as
A + B + products, r = kCACp,
then the orders with respect to CA and to Cg can be obtained by using a large excess of one
component. In this example one might use Ceo >> CAM so that Cg remains nearly constant
in a batch-reactor experiment. Thus the rate would become r = (kc&CA, and a plot of
In CA versus t would have a slope -kCB,. One would then repeat this experiment with
CAM > CsO where a plot of CB versus t would have a slope of kCA,.
Differential-reactor data
Another method to obtain kinetic data is to use a differential reactor in which the concentra-
tion does not change much from the initial concentration CAM. In this case the differential
rate expression
dC.4
- = kc:’
dt
can be written approximately as ACAl&. Taking logarithms, we obtain
In =lnk+mAlnCA
so that a plot of In (AcA/At) versus In CA has a slope of mA and an intercept of In k, as
shown in Figure 2-21. By plotting lines such as these versus temperature, the values of E
and k, can be obtained from differential batch-reactor data.
Statistical analysis of data
The accuracy of data obtained by these methods must be analyzed very carefully to
determine the statistical confidence of rate parameters mj, E, and k, obtained. One must
have data over a sufficient range of CA, t, and T for accurate values, and data should be
analyzed by methods such as least-squares analysis to assess its accuracy.
This analysis assumes random error in data acquisition, and an equally important
problem in any experiment is systematic error, in which measurements are inaccurate