
Page 319 -
P. 319
The Greening of IT
284 How Companies Can Make a Difference for the Environment
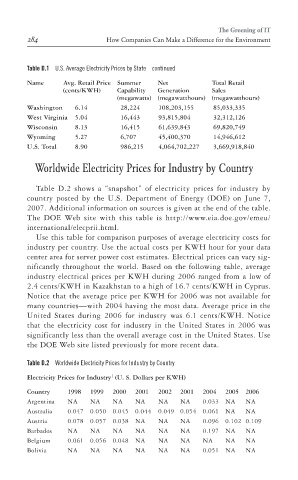
Table D.1 U.S. Average Electricity Prices by State continued
Name Avg. Retail Price Summer Net Total Retail
(cents/KWH) Capability Generation Sales
(megawatts) (megawatthours) (megawatthours)
Washington 6.14 28,224 108,203,155 85,033,335
West Virginia 5.04 16,443 93,815,804 32,312,126
Wisconsin 8.13 16,415 61,639,843 69,820,749
Wyoming 5.27 6,707 45,400,370 14,946,612
U.S. Total 8.90 986,215 4,064,702,227 3,669,918,840
Worldwide Electricity Prices for Industry by Country
Table D.2 shows a “snapshot” of electricity prices for industry by
country posted by the U.S. Department of Energy (DOE) on June 7,
2007. Additional information on sources is given at the end of the table.
The DOE Web site with this table is http://www.eia.doe.gov/emeu/
international/elecprii.html.
Use this table for comparison purposes of average electricity costs for ptg
industry per country. Use the actual costs per KWH hour for your data
center area for server power cost estimates. Electrical prices can vary sig-
nificantly throughout the world. Based on the following table, average
industry electrical prices per KWH during 2006 ranged from a low of
2.4 cents/KWH in Kazakhstan to a high of 16.7 cents/KWH in Cyprus.
Notice that the average price per KWH for 2006 was not available for
many countries—with 2004 having the most data. Average price in the
United States during 2006 for industry was 6.1 cents/KWH. Notice
that the electricity cost for industry in the United States in 2006 was
significantly less than the overall average cost in the United States. Use
the DOE Web site listed previously for more recent data.
Table D.2 Worldwide Electricity Prices for Industry by Country
1
Electricity Prices for Industry (U. S. Dollars per KWH)
Country 1998 1999 2000 2001 2002 2001 2004 2005 2006
Argentina NA NA NA NA NA NA 0.033 NA NA
Australia 0.047 0.050 0.045 0.044 0.049 0.054 0.061 NA NA
Austria 0.078 0.057 0.038 NA NA NA 0.096 0.102 0.109
Barbados NA NA NA NA NA NA 0.197 NA NA
Belgium 0.061 0.056 0.048 NA NA NA NA NA NA
Bolivia NA NA NA NA NA NA 0.051 NA NA