
Page 321 -
P. 321
The Greening of IT
286 How Companies Can Make a Difference for the Environment
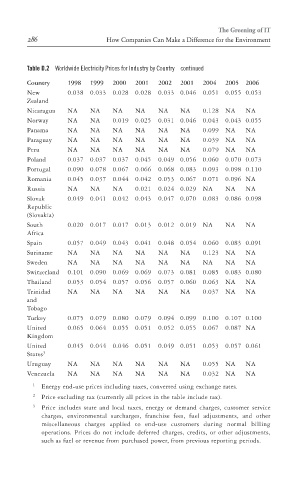
Table D.2 Worldwide Electricity Prices for Industry by Country continued
Country 1998 1999 2000 2001 2002 2001 2004 2005 2006
New 0.038 0.033 0.028 0.028 0.033 0.046 0.051 0.055 0.053
Zealand
Nicaragua NA NA NA NA NA NA 0.128 NA NA
Norway NA NA 0.019 0.025 0.031 0.046 0.043 0.043 0.055
Panama NA NA NA NA NA NA 0.099 NA NA
Paraguay NA NA NA NA NA NA 0.039 NA NA
Peru NA NA NA NA NA NA 0.079 NA NA
Poland 0.037 0.037 0.037 0.045 0.049 0.056 0.060 0.070 0.073
Portugal 0.090 0.078 0.067 0.066 0.068 0.083 0.093 0.098 0.110
Romania 0.045 0.037 0.044 0.042 0.053 0.067 0.071 0.096 NA
Russia NA NA NA 0.021 0.024 0.029 NA NA NA
Slovak 0.049 0.041 0.042 0.043 0.047 0.070 0.083 0.086 0.098
Republic
(Slovakia)
South 0.020 0.017 0.017 0.013 0.012 0.019 NA NA NA
Africa
ptg
Spain 0.057 0.049 0.043 0.041 0.048 0.054 0.060 0.083 0.091
Suriname NA NA NA NA NA NA 0.123 NA NA
Sweden NA NA NA NA NA NA NA NA NA
Switzerland 0.101 0.090 0.069 0.069 0.073 0.081 0.085 0.083 0.080
Thailand 0.053 0.054 0.057 0.056 0.057 0.060 0.063 NA NA
Trinidad NA NA NA NA NA NA 0.037 NA NA
and
Tobago
Turkey 0.075 0.079 0.080 0.079 0.094 0.099 0.100 0.107 0.100
United 0.065 0.064 0.055 0.051 0.052 0.055 0.067 0.087 NA
Kingdom
United 0.045 0.044 0.046 0.051 0.049 0.051 0.053 0.057 0.061
States 3
Uruguay NA NA NA NA NA NA 0.055 NA NA
Venezuela NA NA NA NA NA NA 0.032 NA NA
1 Energy end-use prices including taxes, converted using exchange rates.
2 Price excluding tax (currently all prices in the table include tax).
3 Price includes state and local taxes, energy or demand charges, customer service
charges, environmental surcharges, franchise fees, fuel adjustments, and other
miscellaneous charges applied to end-use customers during normal billing
operations. Prices do not include deferred charges, credits, or other adjustments,
such as fuel or revenue from purchased power, from previous reporting periods.