
Page 242 - The Mechatronics Handbook
P. 242
0066_frame_C12 Page 12 Wednesday, January 9, 2002 4:22 PM
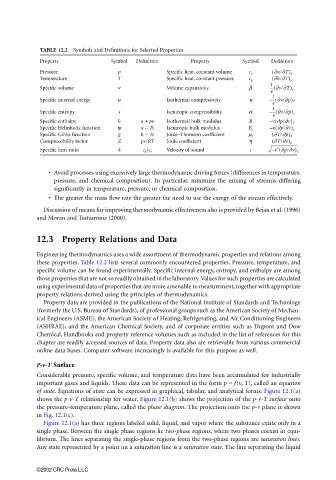
TABLE 12.2 Symbols and Definitions for Selected Properties
Property Symbol Definition Property Symbol Definition
Pressure p Specific heat, constant volume c v ( ∂u/∂T) v
Temperature T Specific heat, constant pressure c p ( ∂h/∂T) p
Specific volume v Volume expansivity β 1 -- ∂v/∂T( ) p
v
Specific internal energy u Isothermal compressivity κ – 1 -- ∂v/∂p( ) T
v
Specific entropy s Isentropic compressibility α – 1 -- ∂v/∂p( ) s
v
(
Specific enthalpy h u + pv Isothermal bulk modulus B – v ∂p/∂v) T
(
Specific Helmholtz function ψ u − Ts Isentropic bulk modulus B s – v ∂p/∂v) s
Specific Gibbs function g h − Ts Joule–Thomson coefficient µ J ( ∂T/∂p) h
Compressibility factor Z pv/RT Joule coefficient η ( ∂T/∂v) u
2
Specific heat ratio k c p /c v Velocity of sound c v – ( ∂p/∂v) s
• Avoid processes using excessively large thermodynamic driving forces (differences in temperature,
pressure, and chemical composition). In particular, minimize the mixing of streams differing
significantly in temperature, pressure, or chemical composition.
• The greater the mass flow rate the greater the need to use the exergy of the stream effectively.
Discussion of means for improving thermodynamic effectiveness also is provided by Bejan et al. (1996)
and Moran and Tsatsaronis (2000).
12.3 Property Relations and Data
Engineering thermodynamics uses a wide assortment of thermodynamic properties and relations among
these properties. Table 12.2 lists several commonly encountered properties. Pressure, temperature, and
specific volume can be found experimentally. Specific internal energy, entropy, and enthalpy are among
those properties that are not so readily obtained in the laboratory. Values for such properties are calculated
using experimental data of properties that are more amenable to measurement, together with appropriate
property relations derived using the principles of thermodynamics.
Property data are provided in the publications of the National Institute of Standards and Technology
(formerly the U.S. Bureau of Standards), of professional groups such as the American Society of Mechan-
ical Engineers (ASME), the American Society of Heating, Refrigerating, and Air Conditioning Engineers
(ASHRAE), and the American Chemical Society, and of corporate entities such as Dupont and Dow
Chemical. Handbooks and property reference volumes such as included in the list of references for this
chapter are readily accessed sources of data. Property data also are retrievable from various commercial
online data bases. Computer software increasingly is available for this purpose as well.
P-v-T Surface
Considerable pressure, specific volume, and temperature data have been accumulated for industrially
important gases and liquids. These data can be represented in the form p = f(v, T), called an equation
of state. Equations of state can be expressed in graphical, tabular, and analytical forms. Figure 12.1(a)
shows the p-v-T relationship for water. Figure 12.1(b) shows the projection of the p-v-T surface onto
the pressure-temperature plane, called the phase diagram. The projection onto the p-v plane is shown
in Fig. 12.1(c).
Figure 12.1(a) has three regions labeled solid, liquid, and vapor where the substance exists only in a
single phase. Between the single phase regions lie two-phase regions, where two phases coexist in equi-
librium. The lines separating the single-phase regions from the two-phase regions are saturation lines.
Any state represented by a point on a saturation line is a saturation state. The line separating the liquid
©2002 CRC Press LLC