
Page 97 - Theory and Design of Air Cushion Craft
P. 97
Calculation of cushion stability derivatives 81
Experimental methods for heave stability derivatives and
damping coefficient
The foregoing formulae can be proved by experimental methods, in particular tests
using ground excitation (a hinged base plate) in test skirt box equipment, then mea-
suring the time history of cushion pressure, vertical displacement of the ground plate,
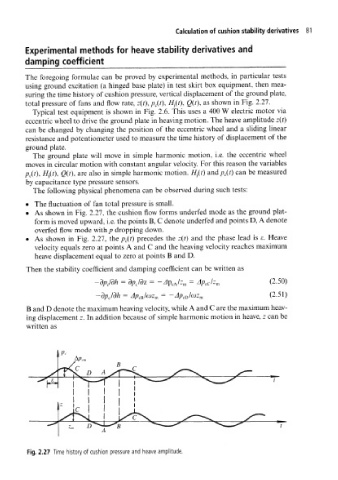
total pressure of fans and flow rate, z(t), p c(t), H- }(t), Q(t), as shown in Fig. 2.27.
Typical test equipment is shown in Fig. 2.6. This uses a 400 W electric motor via
eccentric wheel to drive the ground plate in heaving motion. The heave amplitude z(t)
can be changed by changing the position of the eccentric wheel and a sliding linear
resistance and potentiometer used to measure the time history of displacement of the
ground plate.
The ground plate will move in simple harmonic motion, i.e. the eccentric wheel
moves in circular motion with constant angular velocity. For this reason the variables
p c(t), Hj(t), 0(0, are also in simple harmonic motion. H }(t) and p c(t) can be measured
by capacitance type pressure sensors.
The following physical phenomena can be observed during such tests:
• The fluctuation of fan total pressure is small.
• As shown in Fig. 2.27, the cushion flow forms underfed mode as the ground plat-
form is moved upward, i.e. the points B, C denote underfed and points D, A denote
overfed flow mode with/> dropping down.
• As shown in Fig. 2.27, the p c(t) precedes the z(f) and the phase lead is e. Heave
velocity equals zero at points A and C and the heaving velocity reaches maximum
heave displacement equal to zero at points B and D.
Then the stability coefficient and damping coefficient can be written as
-dpjdh = a/7 /az = -j /z = A iz (2.50)
c
PcA m
PcC m
-8/7 c/9/z = Apjwz m = -Ap c0lcoz m (2.51)
B and D denote the maximum heaving velocity, while A and C are the maximum heav-
ing displacement z. In addition because of simple harmonic motion in heave, z can be
written as
Fig. 2.27 Time history of cushion pressure and heave amplitude.