
Page 205 - Thermal Hydraulics Aspects of Liquid Metal Cooled Nuclear Reactors
P. 205
176 Thermal Hydraulics Aspects of Liquid Metal Cooled Nuclear Reactors
LBE flow rate (kg/s)
Time (h)
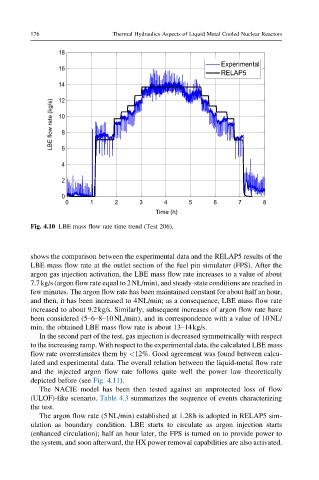
Fig. 4.10 LBE mass flow rate time trend (Test 206).
shows the comparison between the experimental data and the RELAP5 results of the
LBE mass flow rate at the outlet section of the fuel pin simulator (FPS). After the
argon gas injection activation, the LBE mass flow rate increases to a value of about
7.7kg/s (argon flow rate equal to 2NL/min), and steady-state conditions are reached in
few minutes. The argon flow rate has been maintained constant for about half an hour,
and then, it has been increased to 4NL/min; as a consequence, LBE mass flow rate
increased to about 9.2kg/s. Similarly, subsequent increases of argon flow rate have
been considered (5–6–8–10NL/min), and in correspondence with a value of 10NL/
min, the obtained LBE mass flow rate is about 13–14kg/s.
In the second part of the test, gas injection is decreased symmetrically with respect
to the increasing ramp. With respect to the experimental data, the calculated LBE mass
flow rate overestimates them by <12%. Good agreement was found between calcu-
lated and experimental data. The overall relation between the liquid-metal flow rate
and the injected argon flow rate follows quite well the power law theoretically
depicted before (see Fig. 4.11).
The NACIE model has been then tested against an unprotected loss of flow
(ULOF)-like scenario. Table 4.3 summarizes the sequence of events characterizing
the test.
The argon flow rate (5NL/min) established at 1.28h is adopted in RELAP5 sim-
ulation as boundary condition. LBE starts to circulate as argon injection starts
(enhanced circulation); half an hour later, the FPS is turned on to provide power to
the system, and soon afterward, the HX power removal capabilities are also activated.