
Page 236 - Thermal Hydraulics Aspects of Liquid Metal Cooled Nuclear Reactors
P. 236
Subchannel analysis for LMR 207
cos 4θÞ
ð
HTC N ¼ 1 (5.61)
1:82 0:23
P 0:24 λ clad
1+ 42:7 c 1 Pr
D λ coolant
The coefficient c is 1.0 for interior subchannels and equal to 0.712 for edge and corner
subchannels. For hexagonal rod bundles, the following correlation is given:
ð
cos 6θÞ
HTC N ¼ 1 (5.62)
P 0:24 λ clad
2:66 0:23
1 + 613:1 1 Pr
D λ coolant
Here, HTC N stands for the ratio of the local HTC to the averaged HTC, that is, HTC θðÞ .
HTC
According to Eqs. (5.61) and (5.62), the nonuniformity is stronger in case the Prandtl
number of the coolant is larger, that is, the nonuniformity plays more important role in
lead-cooled fast reactors (LFRs) than in SFRs.
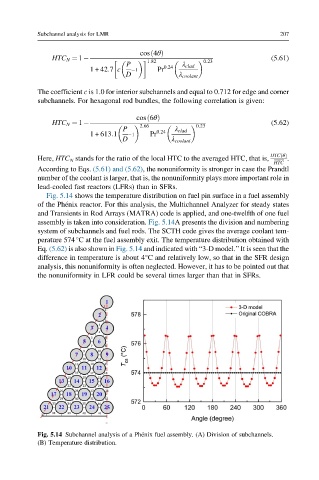
Fig. 5.14 shows the temperature distribution on fuel pin surface in a fuel assembly
of the Ph enix reactor. For this analysis, the Multichannel Analyzer for steady states
and Transients in Rod Arrays (MATRA) code is applied, and one-twelfth of one fuel
assembly is taken into consideration. Fig. 5.14A presents the division and numbering
system of subchannels and fuel rods. The SCTH code gives the average coolant tem-
perature 574°C at the fuel assembly exit. The temperature distribution obtained with
Eq. (5.62) is also shown in Fig. 5.14 and indicated with “3-D model.” It is seen that the
difference in temperature is about 4°C and relatively low, so that in the SFR design
analysis, this nonuniformity is often neglected. However, it has to be pointed out that
the nonuniformity in LFR could be several times larger than that in SFRs.
Fig. 5.14 Subchannel analysis of a Ph enix fuel assembly. (A) Division of subchannels.
(B) Temperature distribution.