
Page 260 - Thermal Hydraulics Aspects of Liquid Metal Cooled Nuclear Reactors
P. 260
Direct numerical simulations for liquid metal applications 231
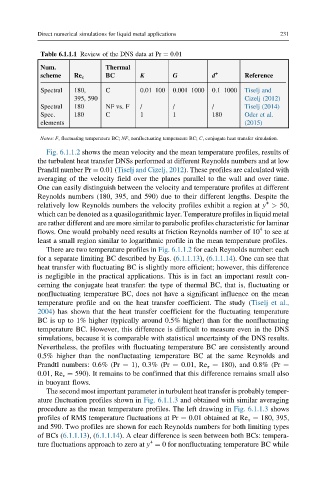
Table 6.1.1.1 Review of the DNS data at Pr ¼ 0.01
Num. Thermal
Re τ K G d +
scheme BC Reference
Spectral 180, C 0.01–100 0.001–1000 0.1–1000 Tiselj and
395, 590 Cizelj (2012)
Spectral 180 NF vs. F / / / Tiselj (2014)
Spec. 180 C 1 1 180 Oder et al.
elements (2015)
Notes: F, fluctuating temperature BC; NF, nonfluctuating temperature BC; C, conjugate heat transfer simulation.
Fig. 6.1.1.2 shows the mean velocity and the mean temperature profiles, results of
the turbulent heat transfer DNSs performed at different Reynolds numbers and at low
Prandtl number Pr ¼ 0.01 (Tiselj and Cizelj, 2012). These profiles are calculated with
averaging of the velocity field over the planes parallel to the wall and over time.
One can easily distinguish between the velocity and temperature profiles at different
Reynolds numbers (180, 395, and 590) due to their different lengths. Despite the
+
relatively low Reynolds numbers the velocity profiles exhibit a region at y > 50,
which can be denoted as a quasilogarithmic layer. Temperature profiles in liquid metal
are rather different and are more similar to parabolic profiles characteristic for laminar
4
flows. One would probably need results at friction Reynolds number of 10 to see at
least a small region similar to logarithmic profile in the mean temperature profiles.
There are two temperature profiles in Fig. 6.1.1.2 for each Reynolds number: each
for a separate limiting BC described by Eqs. (6.1.1.13), (6.1.1.14). One can see that
heat transfer with fluctuating BC is slightly more efficient; however, this difference
is negligible in the practical applications. This is in fact an important result con-
cerning the conjugate heat transfer: the type of thermal BC, that is, fluctuating or
nonfluctuating temperature BC, does not have a significant influence on the mean
temperature profile and on the heat transfer coefficient. The study (Tiselj et al.,
2004) has shown that the heat transfer coefficient for the fluctuating temperature
BC is up to 1% higher (typically around 0.5% higher) than for the nonfluctuating
temperature BC. However, this difference is difficult to measure even in the DNS
simulations, because it is comparable with statistical uncertainty of the DNS results.
Nevertheless, the profiles with fluctuating temperature BC are consistently around
0.5% higher than the nonfluctuating temperature BC at the same Reynolds and
Prandtl numbers: 0.6% (Pr ¼ 1), 0.3% (Pr ¼ 0.01, Re τ ¼ 180), and 0.8% (Pr ¼
0.01, Re τ ¼ 590). It remains to be confirmed that this difference remains small also
in buoyant flows.
The second most important parameter in turbulent heat transfer is probably temper-
ature fluctuation profiles shown in Fig. 6.1.1.3 and obtained with similar averaging
procedure as the mean temperature profiles. The left drawing in Fig. 6.1.1.3 shows
profiles of RMS temperature fluctuations at Pr ¼ 0.01 obtained at Re τ ¼ 180, 395,
and 590. Two profiles are shown for each Reynolds numbers for both limiting types
of BCs (6.1.1.13), (6.1.1.14). A clear difference is seen between both BCs: tempera-
+
ture fluctuations approach to zero at y ¼ 0 for nonfluctuating temperature BC while