
Page 349 - Thermodynamics of Biochemical Reactions
P. 349
Phase Equilibrium in Aqueous Solutions 349
-0.00831451 t Log[Power[E, (-120.272 (-285.83 (1 - 0.00335402 t) - 0.795539 t +
0.5 2 -8 3 0.5
+
(2 is (0.00920483 t - 0.0000128467 t + 4.95199 10 t ))/(1 1.6 is ) -
{{-6.8368, -8.24314, -9.64371}, {-5.7574, -6.94646, -8.1138}, I-2.12304, -2.91737, -3.65
13.03905, 2.57555, 2.12561}, 18.67202, 8.60993, 8.59301}}
[
{
TableForm [Transpose tab11 , TableHeadings-> { "283.15 K" , "298.15 K" , "313.15 K" 1, { "pH
511,18pH 6",I1pH 7","pH 8","pH 911))1
PH 5 PH 6 PH 7 PH 8 PH 9
283.15 K -6.8368 -5.7574 -2.12304 3.03905 8.67202
298.15 K -8.24314 -6.94646 -2.91737 2.57555 8.60993
313.15 K -9.64371 -8.1138 -3.6971 2.12561 8.59301
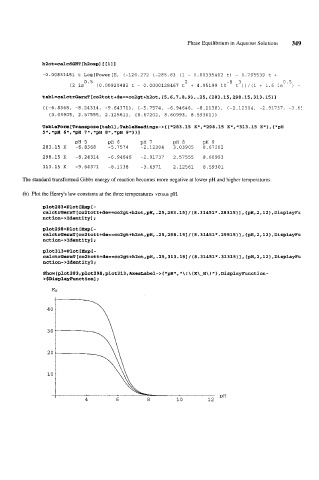
The standard transformed Gibbs energy of reaction becomes more negative at lower pH and higher temperatures.
(b) Plot the Henry's law constants at the three temperatures versus pH.
plot283=Plot [Expt-
ca1ctrOerxT[co2tott+de==co2gt+h2ot,pH,.25,283.15]/(8.31451*.28315)],{pH,2,12~,Dis~1ay~
nction->Identity];
plot298=Plot [Exp I -
ca1ctrGerxT[co2tott+de==co2gt+h2ot,pH,.25,298.151/(8.31451*.29815)1,~pH,2,12~,Disp1ay~
nction->Identity];
plot313=Plot CEXpt-
ca1ctrGerxT[co2tott+de==co2gt+h2ot,pH,.25,313.151/(8.31451*.31315)1,{~H,2,12~,Disp1ayFu
nction->Identity];
\ ! \ ( K\-H\ ) 1 , Di splayFunc t i on -
Show [plot 2 8 3, plot 2 9 8, plot 3 13, Axe sLabel - > { lqpH1l,
>$DisplayFunctionl;