
Page 351 - Thermodynamics of Biochemical Reactions
P. 351
Phase Equilibrium in Aqueous Solutions 351
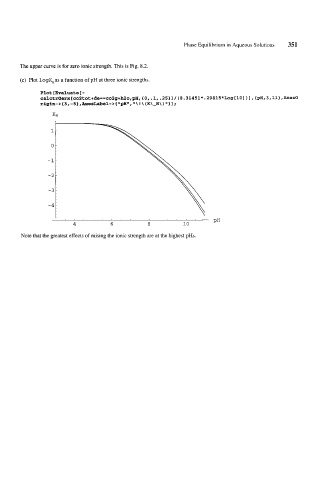
The upper curve is for zero ionic strength. This is Fig. 8.2.
(c) Plot logK,as a function of pH at three ionic strengths.
Plot [Evaluatef-
ca1ctrGerx[co2tot+de==co2g+h2o,~H,{0,.1,.25~1/~8.31451*.29815*Log~101~1,~PH,3,11~~~~S0
rigin-> {3, -5) ,AxesLabel-r pH", 'I\ ! \ (K\LH\) "1 I ;
t
4 6 8 10 PH
Note that the greatest effects of raising the ionic strength are at the highest pHs.