
Page 115 - Bird R.B. Transport phenomena
P. 115
100 Chapter 3 The Equations of Change for Isothermal Systems
Experiments involve some necessary departures from the above analysis: the stream
is finite in size, and fluctuations of velocity are inevitably present at the initial state and
in the upstream fluid. These fluctuations die out rapidly near the cylinder at Re < 1. For
Re approaching 40 the damping of disturbances gets slower, and beyond this approxi-
mate limit unsteady flow is always observed.
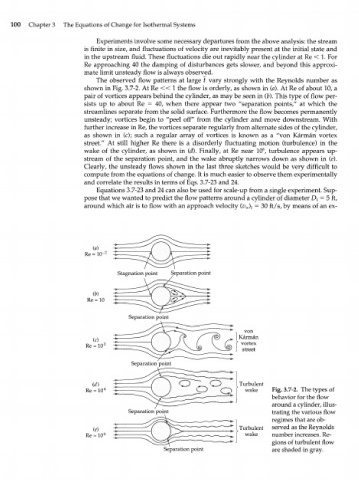
The observed flow patterns at large t vary strongly with the Reynolds number as
<
shown in Fig. 3.7-2. At Re < 1 the flow is orderly, as shown in (a). At Re of about 10, a
pair of vortices appears behind the cylinder, as may be seen in (b). This type of flow per-
sists up to about Re = 40, when there appear two "separation points/' at which the
streamlines separate from the solid surface. Furthermore the flow becomes permanently
unsteady; vortices begin to "peel off" from the cylinder and move downstream. With
further increase in Re, the vortices separate regularly from alternate sides of the cylinder,
as shown in (c); such a regular array of vortices is known as a "von Karman vortex
street." At still higher Re there is a disorderly fluctuating motion (turbulence) in the
6
wake of the cylinder, as shown in (d). Finally, at Re near 10 , turbulence appears up-
stream of the separation point, and the wake abruptly narrows down as shown in (e).
Clearly, the unsteady flows shown in the last three sketches would be very difficult to
compute from the equations of change. It is much easier to observe them experimentally
and correlate the results in terms of Eqs. 3.7-23 and 24.
Equations 3.7-23 and 24 can also be used for scale-up from a single experiment. Sup-
pose that we wanted to predict the flow patterns around a cylinder of diameter D = 5 ft,
Y
around which air is to flow with an approach velocity (IOI = 30 ft/s, by means of an ex-
(я) 2 t " (
Re «10~ —>— • - f\ /л —>~~
Stagnation point Separation point
(b)
Re-10 I {
Separation point
Re-10 2
id) Turbulent
Re-10 4 wake Fig. 3.7=2. The types of
behavior for the flow
around a cylinder, illus-
trating the various flow
regimes that are ob-
(e) Turbulent served as the Reynolds
Re-10 6 wake number increases. Re-
gions of turbulent flow
Separation point are shaded in gray.