
Page 181 - Bird R.B. Transport phenomena
P. 181
§5.5 Turbulent Flow in Ducts 165
(b) For the flow between parallel plates, we can use the expression found in Eq. 5.3-12 for the
time-smoothed velocity profile to get the turbulent momentum flux:
dv
x
(5.4-13)
4
where A = 4C(v*/v) . This is in accord with Eq. 5.4-12.
35.5 TURBULENT FLOW IN DUCTS
We start this section with a short discussion of experimental measurements for turbulent
flow in rectangular ducts, in order to give some impressions about the Reynolds stresses.
In Figs. 5.5^ and 2 are shown some experimental measurements of the time-smoothed
2
quantities v?, v' , and v v for the flow in the z direction in a rectangular duct.
x
x z
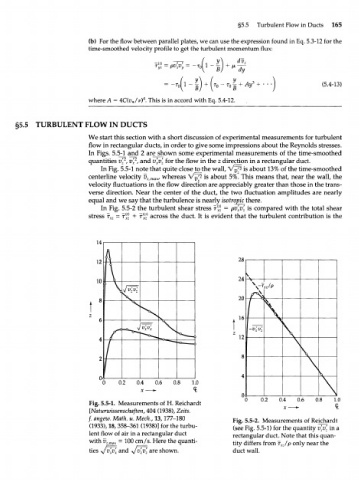
In Fig. 5.5-1 note that quite close to the wall, v 'i is about 13% of the time-smoothed
v
centerline velocity v zmax , whereas V ^ is about 5%. This means that, near the wall, the
velocity fluctuations in the flow direction are appreciably greater than those in the trans-
verse direction. Near the center of the duct, the two fluctuation amplitudes are nearly
equal and we say that the turbulence is nearly isotropic there.
n
In Fig. 5.5-2 the turbulent shear stress T x z = pv' v' is compared with the total shear
z
x
stress r V7 = Tyl + i? across the duct. It is evident that the turbulent contribution is the
(
r
12г
28
24 V Jp
20
16 \ \
\
\
\
0 0.2 0.4 0.6 0.8 1.0
Fig. 5.5-1. Measurements of H. Reichardt
[Naturwissenschaften, 404 (1938), Zeits.
f. angew. Math. u. Mech., 13,177-180 Fig. 5.5-2. Measurements of Reichardt
(1933), 18,358-361 (1938)] for the turbu- (see Fig. 5.5-1) for the quantity v v[ in a
x
lent flow of air in a rectangular duct rectangular duct. Note that this quan-
with v = 100 cm/s. Here the quanti-
zmax tity differs from T /p only near the
XZ
ties Vv' v and y/v v are shown. duct wall.
x x z z