
Page 111 - Uninterruptible Power Supplies
P. 111
Additional Information Relating to the Standby Supply Installation
Additional Information Relating to the Standby Supply Installation 109
2
2
m , and the highest without pain is about 10 watts per m , a power ratio
13
of 10 . If used on a linear scale this range would be unmanageable and
a logarithmic scale is used such that:
Sound power level (SWL)
2
Sound power (watts/m )
10 log 10 decibels (dB) (3.5)
10 12 watts/m 2
The ear is in fact responsive to sound pressure levels and in measur-
ing these the same reference level is used and 10 12 watts/m becomes
2
2
2 10 5 newtons/m . Sound power is proportional to the square of the
pressure and since decibels represent a power ratio the corresponding
equation becomes:
Sound pressure level (SPL)
2
Sound pressure (newtons/m )
20 log 10 decibels (dB) (3.6)
2 10 5 newtons/m 2
The response of the ear to changes of intensity is more logarithmic
than linear so the decibel is a better indication of what we hear than is
a linear scale of pressure. Furthermore, the decibel is said to be the
smallest change in intensity that the normal ear can detect, although
the statement is subjective and frequency dependent.
The Sound Frequency Spectrum`
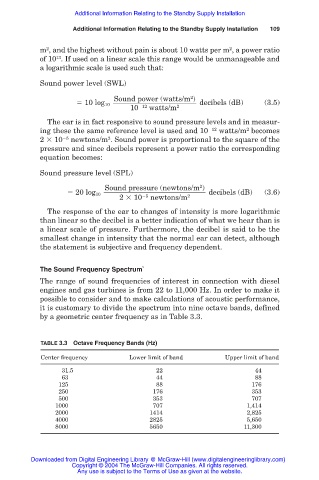
The range of sound frequencies of interest in connection with diesel
engines and gas turbines is from 22 to 11,000 Hz. In order to make it
possible to consider and to make calculations of acoustic performance,
it is customary to divide the spectrum into nine octave bands, defined
by a geometric center frequency as in Table 3.3.
TABLE 3.3 Octave Frequency Bands (Hz)
Center frequency Lower limit of band Upper limit of band
31.5 22 44
63 44 88
125 88 176
250 176 353
500 353 707
1000 707 1,414
2000 1414 2,825
4000 2825 5,650
8000 5650 11,300
Downloaded from Digital Engineering Library @ McGraw-Hill (www.digitalengineeringlibrary.com)
Copyright © 2004 The McGraw-Hill Companies. All rights reserved.
Any use is subject to the Terms of Use as given at the website.