
Page 112 - Uninterruptible Power Supplies
P. 112
Additional Information Relating to the Standby Supply Installation
110 Chapter Three
If a more precise measurement is required each octave band is
divided into three bands of one-third of an octave, thus the highest band
would be divided into three bands with center frequencies of 6300, 8000,
and 10,000 Hz.
In order to establish the acoustic performance of a machine, manu-
facturers measure sound pressure levels for each of the octave bands at
a distance of say, 1 m, from the machine, at a number of positions
around the periphery. From these pressure levels it is possible to cal-
culate by a process of integration the total sound power emitted in each
of the octave bands. These data are essential and are the starting point
for any acoustic calculations that have to be performed.
The human ear is not equally sensitive to all frequencies, in fact it
is least sensitive to low frequencies and most sensitive to midrange
frequencies. A sound level meter accepts all the frequency compo-
nents of the sound and adds all their levels together to indicate an
overall sound intensity. It is more useful to use a subjective indica-
tion which takes into account the frequency response of the ear, and
this is achieved by incorporating in the meter a weighting network
which attenuates the low and high frequencies in accordance with a
defined curve. There are three such standard curves known as A, B,
and C weighting curves and the one of interest in this context is curve
A which, it is generally agreed, represents the sensitivity of the
human ear to the range of audible frequencies. All measurements
which have been weighted in accordance with the curve are expressed
as dBA and it is important that the distinction between dB and dBA is
recorded.
Diesel Engines and Gas Turbines as
Noise Sources
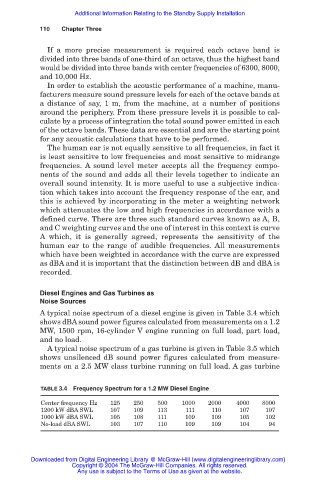
A typical noise spectrum of a diesel engine is given in Table 3.4 which
shows dBA sound power figures calculated from measurements on a 1.2
MW, 1500 rpm, 16-cylinder V engine running on full load, part load,
and no load.
A typical noise spectrum of a gas turbine is given in Table 3.5 which
shows unsilenced dB sound power figures calculated from measure-
ments on a 2.5 MW class turbine running on full load. A gas turbine
TABLE 3.4 Frequency Spectrum for a 1.2 MW Diesel Engine
Center frequency Hz 125 250 500 1000 2000 4000 8000
1200 kW dBA SWL 107 109 113 111 110 107 107
1000 kW dBA SWL 105 108 111 109 109 105 102
No-load dBA SWL 103 107 110 109 109 104 94
Downloaded from Digital Engineering Library @ McGraw-Hill (www.digitalengineeringlibrary.com)
Copyright © 2004 The McGraw-Hill Companies. All rights reserved.
Any use is subject to the Terms of Use as given at the website.