
Page 22 - Using ANSYS for Finite Element Analysis Dynamic, Probabilistic, Design and Heat Transfer Analysis
P. 22
Dynamic analysis • 9
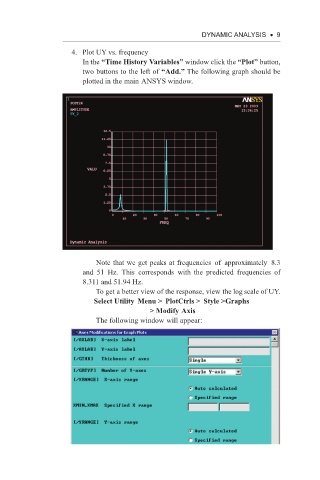
4. Plot UY vs. frequency
In the “Time History Variables” window click the “Plot” button,
two buttons to the left of “Add.” The following graph should be
plotted in the main ANSYS window.
Note that we get peaks at frequencies of approximately 8.3
and 51 Hz. This corresponds with the predicted frequencies of
8.311 and 51.94 Hz.
To get a better view of the response, view the log scale of UY.
Select Utility Menu > PlotCtrls > Style >Graphs
> Modify Axis
The following window will appear: