
Page 27 - Using ANSYS for Finite Element Analysis Dynamic, Probabilistic, Design and Heat Transfer Analysis
P. 27
14 • using ansys for finite eLement anaLysis
The following table compares the mode frequencies (in Hz)
predicted by theory and ANSYS.
Mode Theory ANSYS Percent error
1 8.311 8.300 0.1
2 51.94 52.01 0.2
3 145.68 145.64 0.0
4 285.69 285.51 0.0
5 472.22 472.54 0.1
Note: To obtain accurate higher mode frequencies, this mesh
would have to be refined even more (i.e., instead of ten ele-
ments, we would have to model the cantilever using 15 or more
elements depending on the highest mode frequency of interest).
2. View mode shapes
Select General Postproc > Read Results > First Set
This selects the results for the first mode shape.
Select General Postproc > Plot Results > Deformed shape.
Select “Def + undef edge”
The first mode shape will now appear in the graphics window.
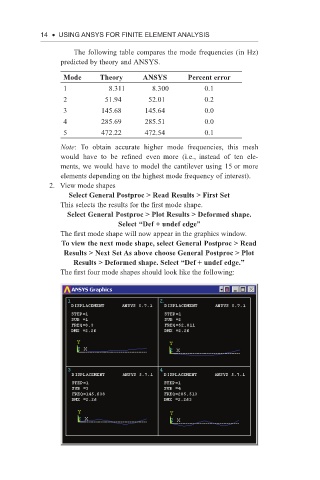
To view the next mode shape, select General Postproc > Read
Results > Next Set As above choose General Postproc > Plot
Results > Deformed shape. Select “Def + undef edge.”
The first four mode shapes should look like the following: