
Page 344 -
P. 344
343
Q8-4 How Do (Some) Companies Earn Revenue from Social Media?
22
revenue from virtual goods. Wikipedia took in about $52.8M in donations during 2014.
Interestingly some SM companies, like Pinterest, don’t generate any revenue at all. They just
focus on building a large network of users now and figuring out how to make money later.
Social media is the ultimate expression of use increasing value. The more communities of
practice there are, the more people, and the more incentive people will have to come back again
and again. So, social media would seem to be the next great revenue generator, except, possibly, for
the movement from PCs to mobile devices.
Does Mobility Reduce Online Ad Revenue?
The ad click revenue model successfully emerged on PC devices where there is plenty of space for
lots of ads. However, as users move from PCs to mobile devices, particularly small-screen smart-
phones, there is much less ad space. Does this mean a reduction in ad revenue?
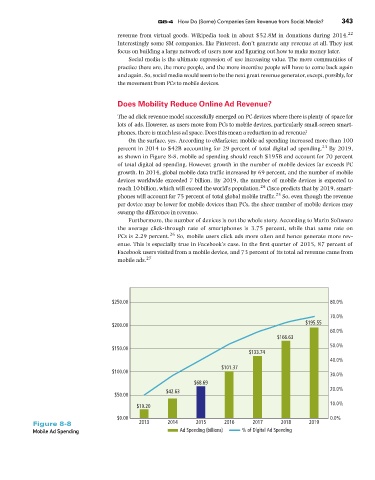
On the surface, yes. According to eMarketer, mobile ad spending increased more than 100
23
percent in 2014 to $42B accounting for 29 percent of total digital ad spending. By 2019,
as shown in Figure 8-8, mobile ad spending should reach $195B and account for 70 percent
of total digital ad spending. However, growth in the number of mobile devices far exceeds PC
growth. In 2014, global mobile data traffic increased by 69 percent, and the number of mobile
devices worldwide exceeded 7 billion. By 2019, the number of mobile devices is expected to
24
reach 10 billion, which will exceed the world’s population. Cisco predicts that by 2019, smart-
25
phones will account for 75 percent of total global mobile traffic. So, even though the revenue
per device may be lower for mobile devices than PCs, the sheer number of mobile devices may
swamp the difference in revenue.
Furthermore, the number of devices is not the whole story. According to Marin Software
the average click-through rate of smartphones is 3.75 percent, while that same rate on
26
PCs is 2.29 percent. So, mobile users click ads more often and hence generate more rev-
enue. This is especially true in Facebook’s case. In the first quarter of 2015, 87 percent of
Facebook users visited from a mobile device, and 73 percent of its total ad revenue came from
mobile ads. 27
$250.00 80.0%
70.0%
$200.00 $195.55
60.0%
$166.63
50.0%
$150.00
$133.74
40.0%
$101.37
$100.00
30.0%
$68.69
$42.63 20.0%
$50.00
$19.20 10.0%
$0.00 0.0%
Figure 8-8 2013 2014 2015 2016 2017 2018 2019
Mobile Ad Spending Ad Spending (billions) % of Digital Ad Spending