
Page 115 - Vibrational Spectroscopic Imaging for Biomedical Applications
P. 115
Sample Pr eparation of Cells and T issue 91
1112
(b) 1288
1031 1550 1575
823 922 1421
1295
1393
1143 1428 1550 1580
1002
Raman Signal (a. u.) 898 963 1002 1073 1267 1340 1448 1486
1155 1435
875 1098
1285 1579
827 1245 1375 1550
800 1000 1200 1400 1600
–1
Raman Shift (cm )
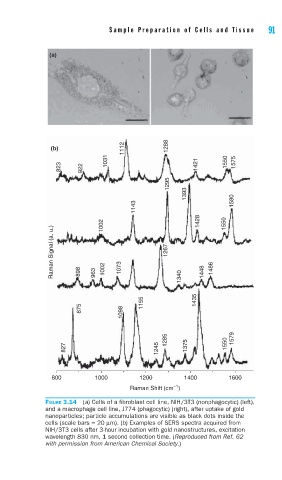
FIGURE 3.14 (a) Cells of a fi broblast cell line, NIH/3T3 (nonphagocytic) (left),
and a macrophage cell line, J774 (phagocytic) (right), after uptake of gold
nanoparticles; particle accumulations are visible as black dots inside the
cells (scale bars = 20 μm). (b) Examples of SERS spectra acquired from
NIH/3T3 cells after 3-hour incubation with gold nanostructures, excitation
wavelength 830 nm, 1 second collection time. (Reproduced from Ref. 62
with permission from American Chemical Society.)