
Page 112 - Vibrational Spectroscopic Imaging for Biomedical Applications
P. 112
88 Cha pte r T h ree
supporting evidence for the justification of this experimental setup
for measuring single-point SR-FTIR spectra from single living cells.
Since the experiment was carried out for only 30 minutes, changes in
the spectrum over an extended time-period, which is required to
obtain cell maps, is unknown. However, using a different experimen-
tal design for the sample compartment, Miljkovic et al. reported no
spectral changes in spectra collected from live cells when data were
collected every 30 minutes for 3 hours. 59
59
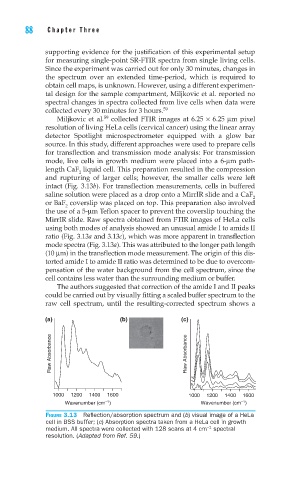
Miljkovic et al. collected FTIR images at 6.25 × 6.25 μm pixel
resolution of living HeLa cells (cervical cancer) using the linear array
detector Spotlight microspectrometer equipped with a glow bar
source. In this study, different approaches were used to prepare cells
for transflection and transmission mode analysis: For transmission
mode, live cells in growth medium were placed into a 6-μm path-
length CaF liquid cell. This preparation resulted in the compression
2
and rupturing of larger cells; however, the smaller cells were left
intact (Fig. 3.13b). For transflection measurements, cells in buffered
saline solution were placed as a drop onto a MirrIR slide and a CaF
2
or BaF coverslip was placed on top. This preparation also involved
2
the use of a 5-μm Teflon spacer to prevent the coverslip touching the
MirrIR slide. Raw spectra obtained from FTIR images of HeLa cells
using both modes of analysis showed an unusual amide I to amids II
ratio (Fig. 3.13a and 3.13c), which was more apparent in transflection
mode spectra (Fig. 3.13a). This was attributed to the longer path length
(10 μm) in the transflection mode measurement. The origin of this dis-
torted amide I to amide II ratio was determined to be due to overcom-
pensation of the water background from the cell spectrum, since the
cell contains less water than the surrounding medium or buffer.
The authors suggested that correction of the amide I and II peaks
could be carried out by visually fitting a scaled buffer spectrum to the
raw cell spectrum, until the resulting-corrected spectrum shows a
(a) (b) (c)
Raw Absorbance Raw Absorbance
1000 1200 1400 1600 1000 1200 1400 1600
–1
–1
Wavenumber (cm ) Wavenumber (cm )
FIGURE 3.13 Refl ection/absorption spectrum and (b) visual image of a HeLa
cell in BSS buffer; (c) Absorption spectra taken from a HeLa cell in growth
−1
medium. All spectra were collected with 128 scans at 4 cm spectral
resolution. (Adapted from Ref. 59.)