
Page 108 - Vibrational Spectroscopic Imaging for Biomedical Applications
P. 108
84 Cha pte r T h ree
was used as the artificial ECM. The major constituents of Matrigel are
collagen type IV (a protein), heparan sulphate (a proteoglycan), lam-
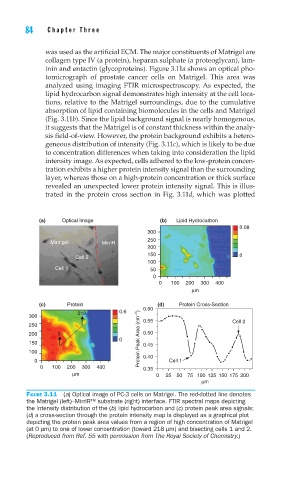
inin and entactin (glycoproteins). Figure 3.11a shows an optical pho-
tomicrograph of prostate cancer cells on Matrigel. This area was
analyzed using imaging FTIR microspectroscopy. As expected, the
lipid hydrocarbon signal demonstrates high intensity at the cell loca-
tions, relative to the Matrigel surroundings, due to the cumulative
absorption of lipid containing biomolecules in the cells and Matrigel
(Fig. 3.11b). Since the lipid background signal is nearly homogenous,
it suggests that the Matrigel is of constant thickness within the analy-
sis field-of-view. However, the protein background exhibits a hetero-
geneous distribution of intensity (Fig. 3.11c), which is likely to be due
to concentration differences when taking into consideration the lipid
intensity image. As expected, cells adhered to the low-protein concen-
tration exhibits a higher protein intensity signal than the surrounding
layer, whereas those on a high-protein concentration or thick surface
revealed an unexpected lower protein intensity signal. This is illus-
trated in the protein cross section in Fig. 3.11d, which was plotted
(a) Optical Image (b) Lipid Hydrocarbon
0.08
300
250
Matrigel MirrlR
200
150 0
Cell 2
100
Cell 1 50
0
0 100 200 300 400
μm
(c) Protein (d) Protein Cross-Section
0.60
218 0.6
300
250 0.55 Cell 2
200 0 0.50
0 Protein Peak Area (cm –1 )
150 0.45
100
0 0.40 Cell 1
0 100 200 300 400 0.35
μm 0 25 50 75 100 125 150 175 200
μm
FIGURE 3.11 (a) Optical image of PC-3 cells on Matrigel. The red-dotted line denotes
the Matrigel (left)–MirrIR™ substrate (right) interface. FTIR spectral maps depicting
the intensity distribution of the (b) lipid hydrocarbon and (c) protein peak area signals;
(d) a cross-section through the protein intensity map is displayed as a graphical plot
depicting the protein peak area values from a region of high concentration of Matrigel
(at 0 μm) to one of lower concentration (toward 218 μm) and bisecting cells 1 and 2.
(Reproduced from Ref. 55 with permission from The Royal Society of Chemistry.)