
Page 105 - Vibrational Spectroscopic Imaging for Biomedical Applications
P. 105
Sample Pr eparation of Cells and T issue 81
optimum growth of different cell lines. In some instances, cell culture
media may be different for cells of the same epithelial origin, for
example, ECACC suggest PC-3 cells (prostate cancer epithelial cell
line derived from bone metastases) should be grown in Ham’s F-12,
whereas LNCap-FGC (prostate cancer epithelial cell line derived
from lymph node metastases) should be grown in RPMI 1640. The
question arises: Should investigations aiming to discriminating cell
types include data from cells grown in the same media or does it mat-
ter if cells are grown in different media? Taking the example of PC-3
and LNCap-FGC cell lines, both RPMI 1640 and Ham’s F-12 are com-
plex mixtures consisting of a range of inorganic salts, amino acids,
vitamins, nucleotides and glucose as well as small-molecule precur-
sors. However, differences between media can exist with respect to
the relative concentrations of each component as well as composi-
tional differences such as the presence or absence of a major biomo-
lecular class, for instance RPMI 1640 contains no fatty acids, unlike
Ham’s F-12, which contains the 6-FA, linoleic acid (LA).
50
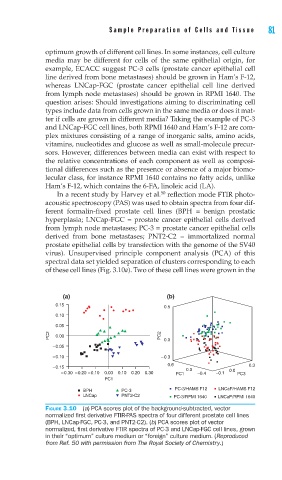
In a recent study by Harvey et al. reflection mode FTIR photo-
acoustic spectroscopy (PAS) was used to obtain spectra from four dif-
ferent formalin-fixed prostate cell lines (BPH = benign prostatic
hyperplasia; LNCap-FGC = prostate cancer epithelial cells derived
from lymph node metastases; PC-3 = prostate cancer epithelial cells
derived from bone metastases; PNT2-C2 = immortalized normal
prostate epithelial cells by transfection with the genome of the SV40
virus). Unsupervised principle component analysis (PCA) of this
spectral data set yielded separation of clusters corresponding to each
of these cell lines (Fig. 3.10a). Two of these cell lines were grown in the
(a) (b)
0.15
0.5
0.10
0.05
PC2 0.00 PC2 0.0
–0.05
–0.10 –0.3
0.6 0.3
–0.15 0.0
–0.30 –0.20 –0.10 0.00 0.10 0.20 0.30 PC1 –0.4 –0.1 0.0 PC3
PC1
BPH PC-3 PC-3/HAMS F12 LNCaP/HAMS F12
LNCap PNT2-C2 PC-3/RPMI 1640 LNCaP/RPMI 1640
FIGURE 3.10 (a) PCA scores plot of the background-subtracted, vector
normalized fi rst derivative FTIR-PAS spectra of four different prostate cell lines
(BPH, LNCap-FGC, PC-3, and PNT2-C2). (b) PCA scores plot of vector
normalized, fi rst derivative FTIR spectra of PC-3 and LNCap-FGC cell lines, grown
in their “optimum” culture medium or “foreign” culture medium. (Reproduced
from Ref. 50 with permission from The Royal Society of Chemistry.)