
Page 102 - Vibrational Spectroscopic Imaging for Biomedical Applications
P. 102
78 Cha pte r T h ree
(a) Optical Image (i) Extended Field-of-View (b) υ (CD) 2+3
as
–1944 0.06
(i) (ii)
–2000
0
–2056
–14866 –14800 –14700 –14641
μm
–1945 –1974
Adp. 3 (i) 0.005 –1980 0.08 2 (ii)
Adp. 1 Adp. 2 –1960 4
Sub 1 0 –2000 0
–1980
3
–2000 1 –2020 Sub 2
Sub 3 –2050
50 μm
–2020 –14794 –14750 –14727
(ii) Enlarged Area –14864 –14792
FTIR Analysed Location
2
4
3
Adp. 3
1
Adp. 2
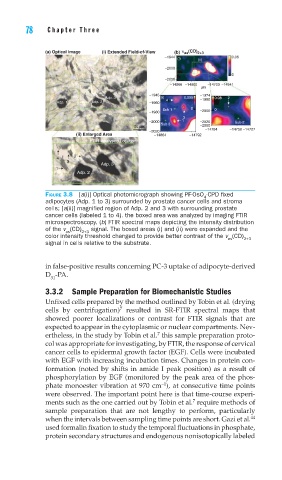
FIGURE 3.8 [a(i)] Optical photomicrograph showing PF-OsO -CPD fi xed
4
adipocytes (Adp. 1 to 3) surrounded by prostate cancer cells and stroma
cells; [a(ii)] magnifi ed region of Adp. 2 and 3 with surrounding prostate
cancer cells (labeled 1 to 4). the boxed area was analyzed by imaging FTIR
microspectroscopy. (b) FTIR spectral maps depicting the intensity distribution
of the v (CD) signal. The boxed areas (i) and (ii) were expanded and the
as 2+3
color intensity threshold changed to provide better contrast of the v (CD) 2+3
as
signal in cells relative to the substrate.
in false-positive results concerning PC-3 uptake of adipocyte-derived
D -PA.
31
3.3.2 Sample Preparation for Biomechanistic Studies
Unfixed cells prepared by the method outlined by Tobin et al. (drying
7
cells by centrifugation) resulted in SR-FTIR spectral maps that
showed poorer localizations or contrast for FTIR signals that are
expected to appear in the cytoplasmic or nuclear compartments. Nev-
7
ertheless, in the study by Tobin et al. this sample preparation proto-
col was appropriate for investigating, by FTIR, the response of cervical
cancer cells to epidermal growth factor (EGF). Cells were incubated
with EGF with increasing incubation times. Changes in protein con-
formation (noted by shifts in amide I peak position) as a result of
phosphorylation by EGF (monitored by the peak area of the phos-
−1
phate monoester vibration at 970 cm ), at consecutive time points
were observed. The important point here is that time-course experi-
7
ments such as the one carried out by Tobin et al. require methods of
sample preparation that are not lengthy to perform, particularly
when the intervals between sampling time points are short. Gazi et al. 44
used formalin fixation to study the temporal fluctuations in phosphate,
protein secondary structures and endogenous nonisotopically labeled