
Page 103 - Vibrational Spectroscopic Imaging for Biomedical Applications
P. 103
Sample Pr eparation of Cells and T issue 79
lipid signals following stimulation with different concentrations of
D -PA and deuterated arachidonic acid (D -AA). It was found that
31 8
the shortest practical-time interval between sampling points during
which the cells could be fixed was 15 minutes. As an example, Fig. 3.9a
shows these biochemical fluctuations for PC-3 cells incubated with 50
μm D -PA in serum-free culture media, compared with control (PC-3
31
cells incubated in identical conditions but without D -PA). The
31
endogenous lipid signal in the control PC-3 cells initially fell and is
induced by metabolic/cytokine/growth factor imbalance resulting
PC-3 Endogenous Lipid Signal 18 2 1
Control (No D -PA)
(a) 20 Lipid Signal 31 50 μM D -PA (b) Optical Image
31
16
14
12
Phosphate
1425 1450
50
0
150
100
5236
0.04
PC-3 Phosphate Signal 6.0 –15962 –15900 –15774 0.02
Nel
6.5 Phosphate Signal
5200
5150
5.5
5105
0
μm
5.0
5226
5200
4.5
5142
4.0
0 50 100 150 1425 1450 –15900 –15812 0
Amide l
–1
Wavenumber (cm ) (c–d)
1650 Protein Secondary Structure 5236 0.01
α-Helix
5200
1648
1646 5150
Random
1644 5105 0
Coil –15962 –15900 –15744
5226
1642 μm 5200 1 2 0.04
1640
β-Sheet 5142 –15812 0
–15900
0 50 100 150 1425 1450
Time (min)
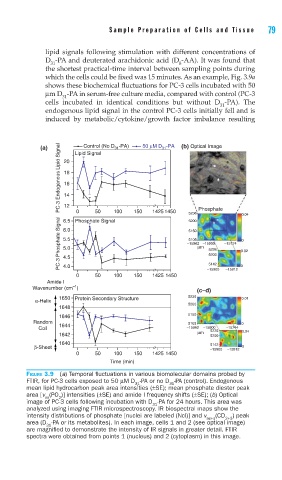
FIGURE 3.9 (a) Temporal fl uctuations in various biomolecular domains probed by
FTIR, for PC-3 cells exposed to 50 μM D -PA or no D -PA (control). Endogenous
31 31
mean lipid hydrocarbon peak area intensities (±SE); mean phosphate diester peak
area [v (PO )] intensities (±SE) and amide I frequency shifts (±SE); (b) Optical
as 2
image of PC-3 cells following incubation with D -PA for 24 hours. This area was
31
analyzed using imaging FTIR microspectroscopy. IR biospectral maps show the
intensity distributions of phosphate [nuclei are labeled (Ncl)] and v (CD ) peak
as+s 2+3
area (D -PA or its metabolites). In each image, cells 1 and 2 (see optical image)
31
are magnifi ed to demonstrate the intensity of IR signals in greater detail. FTIR
spectra were obtained from points 1 (nucleus) and 2 (cytoplasm) in this image.