
Page 99 - Vibrational Spectroscopic Imaging for Biomedical Applications
P. 99
Sample Pr eparation of Cells and T issue 75
(b) Phosphate
30
(a) Optical Image
20
2 N High
1
10
0
27
21 0 20 40 60 80
15 μm
9
3 (c) Lipid (C=O)
3 1221 30 39 48 57 66 75 30
C 20 Low
10
0
0 20 40 60 80
μm
(d) 1.0 A. Glutaraldehyde-OsO CPD Fixed
4
0.8 PC-3 Cell
0.6
0.4
0.2
Absorbance 1.0 3000 2900 2800 1800 1600 1400 1200 1000 800
0.0
0.8 B. Glutaraldehyde
0.6
0.4
0.2
0.0
3000 2900 2800 1800 1600 1400 1200 1000 800
–1
Wavenumber (cm )
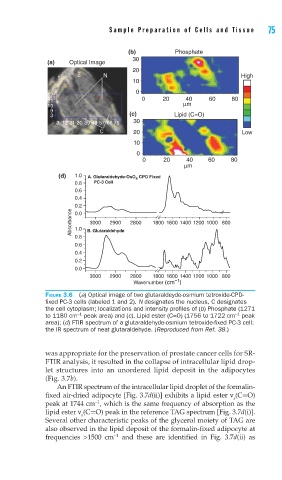
FIGURE 3.6 (a) Optical image of two glutaraldeyde-osmium tetroxide-CPD-
fi xed PC-3 cells (labeled 1 and 2). N designates the nucleus, C designates
the cell cytoplasm; localizations and intensity profi les of (b) Phosphate (1271
−1
−1
to 1180 cm peak area) and (c). Lipid ester (C=O) (1756 to 1722 cm peak
area); (d) FTIR spectrum of a glutaraldehyde-osmium tetroxide-fi xed PC-3 cell;
the IR spectrum of neat glutaraldehyde. (Reproduced from Ref. 38.)
was appropriate for the preservation of prostate cancer cells for SR-
FTIR analysis, it resulted in the collapse of intracellular lipid drop-
let structures into an unordered lipid deposit in the adipocytes
(Fig. 3.7b).
An FTIR spectrum of the intracellular lipid droplet of the formalin-
fixed air-dried adipocyte [Fig. 3.7d(ii)] exhibits a lipid ester ν (C=O)
s
−1
peak at 1744 cm , which is the same frequency of absorption as the
lipid ester ν (C=O) peak in the reference TAG spectrum [Fig. 3.7d(i)].
s
Several other characteristic peaks of the glycerol moiety of TAG are
also observed in the lipid deposit of the formalin-fixed adipocyte at
−1
frequencies >1500 cm and these are identified in Fig. 3.7d(ii) as