
Page 94 - Vibrational Spectroscopic Imaging for Biomedical Applications
P. 94
70 Cha pte r T h ree
18
35
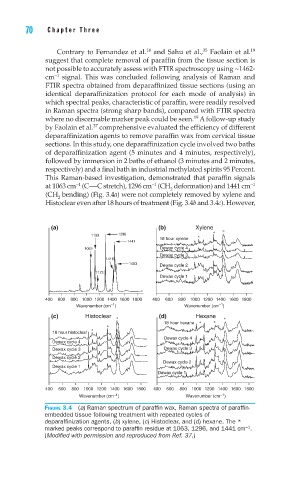
Contrary to Fernandez et al. and Sahu et al., Faolain et al. 19
suggest that complete removal of paraffin from the tissue section is
not possible to accurately assess with FTIR spectroscopy using ~1462-
−1
cm signal. This was concluded following analysis of Raman and
FTIR spectra obtained from deparaffinized tissue sections (using an
identical deparaffinization protocol for each mode of analysis) in
which spectral peaks, characteristic of paraffin, were readily resolved
in Raman spectra (strong sharp bands), compared with FTIR spectra
19
where no discernable marker peak could be seen. A follow-up study
37
by Faolain et al. comprehensive evaluated the efficiency of different
deparaffinization agents to remove paraffin wax from cervical tissue
sections. In this study, one deparaffinization cycle involved two baths
of deparaffinization agent (5 minutes and 4 minutes, respectively),
followed by immersion in 2 baths of ethanol (3 minutes and 2 minutes,
respectively) and a final bath in industrial methylated spirits 95 Percent.
This Raman-based investigation, demonstrated that paraffin signals
−1
−1
at 1063 cm (C ⎯ C stretch), 1296 cm (CH deformation) and 1441 cm −1
2
(CH bending) (Fig. 3.4a) were not completely removed by xylene and
2
Histoclear even after 18 hours of treatment (Fig. 3.4b and 3.4c). However,
(a) (b) Xylene ∗
1133 1296 ∗ ∗
18 hour xylene
1441
1063 Dewax cycle 4
Dewax cycle 3
1418
1463 Dewax cycle 2
1172
Dewax cycle 1
400 600 800 1000 1200 1400 1600 1800 400 600 800 1000 1200 1400 1600 1800
–1
–1
Wavenumber (cm ) Wavenumber (cm )
(c) Histoclear ∗ (d) Hexane ∗
18 hour hexane ∗ ∗
∗
∗
18 hour histoclear
Dewax cycle 4
Dewax cycle 4
Dewax cycle 3 Dewax cycle 3
Dewax cycle 2
Dewax cycle 2
Dewax cycle 1
Dewax cycle 1
400 600 800 1000 1200 1400 1600 1800 400 600 800 1000 1200 1400 1600 1800
–1
Wavenumber (cm ) Wavenumber (cm –1 )
FIGURE 3.4 (a) Raman spectrum of paraffi n wax, Raman spectra of paraffi n-
embedded tissue following treatment with repeated cycles of
deparaffi nization agents, (b) xylene, (c) Histoclear, and (d) hexane. The *
−1
marked peaks correspond to paraffi n residue at 1063, 1296, and 1441 cm .
(Modifi ed with permission and reproduced from Ref. 37.)