
Page 93 - Vibrational Spectroscopic Imaging for Biomedical Applications
P. 93
Sample Pr eparation of Cells and T issue 69
any significant changes to the lipid spectral regions (2800 to 3000 cm −1
−1
and 1426 to 1483 cm ). Further treatment with alcohol produced
−1
changes to the region 900 to 1185 cm , which was speculated to be
the result of residue xylene removal. Alcohol treatment also showed
a further reduction in lipid hydrocarbon signals in the spectral region
−1
2800 to 3000 cm . The authors observed that hematoxylin and eosin
(H&E) sections of these deparaffinized tissues exhibited clear out-
lines for the cells that indicated the preservation of lipids in complex
forms (membranes).
19
Faolain et al. deparaffinized parenchymal tissue sections by
immersing in two baths of xylene for 5 and 4 minutes, respectively.
Followed by two baths of absolute ethanol for 3 and 2 minutes and a
final bath of industrial methylated spirits 95 percent for 1 minute.
This method was found through Raman microspectroscopy to be
inefficient at removing all of the paraffin, since a number of strong
19
signals from C⎯C and CH vibrational modes were observed. Gazi
2
36
et al. deparaffinized their prostate tissue sections by immersion in
Citroclear (a deparaffinization agent that is less toxic than xylene)
and placed on an orbital mixer for 6 minutes and then in acetone for
a further 6 minutes at 4ºC before being air-dried for 1 hour under
ambient conditions. A commonality between the latter three proce-
dures is the use of additional organic solvent(s) used to remove any
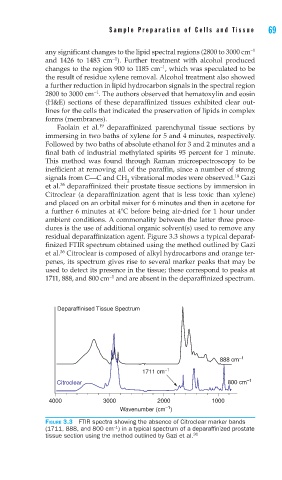
residual deparaffinization agent. Figure 3.3 shows a typical deparaf-
finized FTIR spectrum obtained using the method outlined by Gazi
36
et al. Citroclear is composed of alkyl hydrocarbons and orange ter-
penes, its spectrum gives rise to several marker peaks that may be
used to detect its presence in the tissue; these correspond to peaks at
−1
1711, 888, and 800 cm and are absent in the deparaffinized spectrum.
Deparaffinised Tissue Spectrum
888 cm –1
1711 cm –1
Citroclear 800 cm –1
4000 3000 2000 1000
–1
Wavenumber (cm )
FIGURE 3.3 FTIR spectra showing the absence of Citroclear marker bands
–1
(1711, 888, and 800 cm ) in a typical spectrum of a deparaffi nized prostate
tissue section using the method outlined by Gazi et al. 36