
Page 96 - Vibrational Spectroscopic Imaging for Biomedical Applications
P. 96
72 Cha pte r T h ree
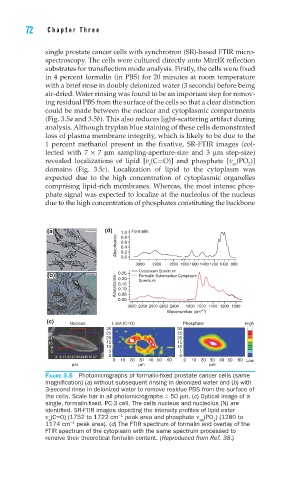
single prostate cancer cells with synchrotron (SR)-based FTIR micro-
spectroscopy. The cells were cultured directly onto MirrIR reflection
substrates for transflection mode analysis. Firstly, the cells were fixed
in 4 percent formalin (in PBS) for 20 minutes at room temperature
with a brief rinse in doubly deionized water (3 seconds) before being
air-dried. Water rinsing was found to be an important step for remov-
ing residual PBS from the surface of the cells so that a clear distinction
could be made between the nuclear and cytoplasmic compartments
(Fig. 3.5a and 3.5b). This also reduces light-scattering artifact during
analysis. Although tryplan blue staining of these cells demonstrated
loss of plasma membrane integrity, which is likely to be due to the
1 percent methanol present in the fixative, SR-FTIR images (col-
lected with 7 × 7 μm sampling-aperture-size and 3 μm step-size)
revealed localizations of lipid [v (C=O)] and phosphate [v (PO )]
s as 2
domains (Fig. 3.5c). Localization of lipid to the cytoplasm was
expected due to the high concentration of cytoplasmic organelles
comprising lipid-rich membranes. Whereas, the most intense phos-
phate signal was expected to localize at the nucleolus of the nucleus
due to the high concentration of phosphates constituting the backbone
(a) (d) 1.0 Formalin
Absorbance 0.6
0.8
0.4
0.2
0.0
3000 2900 2800 18001600 1400 1200 1000 800
Cytoplasm Spectrum
(b) 0.25 Formalin Substracted Cytoplasm
Absorbance 0.15
0.20
Spectrum
0.10
0.05
0.00
3000 2950 2900 2850 2800 1800 1500 1400 1200 1000
Wavenumber (cm –1 )
(c) Nucleus Lipid (C = O) Phosphate High
30 30
27 25 25
21 20 20
15 15 15
9 N 10 10
3 5 5
3 9 15 21 27 33 39 45 51 57 0 0
0 10 20 30 40 50 60 0 10 20 30 40 50 60 Low
μm μm μm
FIGURE 3.5 Photomicrographs of formalin-fi xed prostate cancer cells (same
magnifi cation) (a) without subsequent rinsing in deionized water and (b) with
3-second rinse in deionized water to remove residue PBS from the surface of
the cells. Scale bar in all photomicrographs = 50 μm. (c) Optical image of a
single, formalin-fi xed, PC-3 cell. The cells nucleus and nucleolus (N) are
identifi ed. SR-FTIR images depicting the intensity profi les of lipid ester
−1
ν (C=O) (1752 to 1722 cm peak area and phosphate ν (PO ) (1280 to
s as 2
−1
1174 cm peak area). (d) The FTIR spectrum of formalin and overlay of the
FTIR spectrum of the cytoplasm with the same spectrum processed to
remove their theoretical formalin content. (Reproduced from Ref. 38.)