
Page 110 - Vibrational Spectroscopic Imaging for Biomedical Applications
P. 110
86 Cha pte r T h ree
(a)
Matrigel 0 h 4 h 44 min 5 h 15 min 16 h 50 min
MirrlR
17 h 55 min 18 h 18 min 19 h 16 min 22 h 22 min
(b)
Final Time-Lapse Video Frame Brightfield Image of Fixed Area
(i) (ii)
350 Protein 0.57 (v)
300 1.4 Location 1
1.2
250 1.0
200 1 0 0.8
0.6
150 0.4
0.2
100 0.0
50 3 2 4000 3500 3000 2500 2000 1500 1000
(iii)
0 1.4 Location 2
Absorbance 0.6
0 100 200 400 1.2
1.0
μm 0.8
0.2
350 Lipid 0.09 0.4
0.0
300 Hydrocarbon 4000 3500 3000 2500 2000 1500 1000
250
1.4 Location 3
200 1.2
0
150 1.0
0.8
100 0.6
0.4
50 0.2
(iv) 0.0
0 4000 3500 3000 2500 2000 1500 1000
0 100 200 400 Wavenumber (cm )
–1
μm
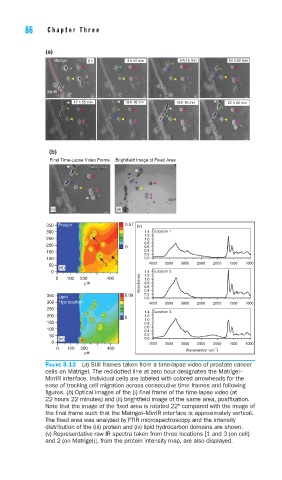
FIGURE 3.12 (a) Still frames taken from a time-lapse video of prostate cancer
cells on Matrigel. The red-dotted line at zero hour designates the Matrigel–
MirrIR interface. Individual cells are labeled with colored arrowheads for the
ease of tracking cell migration across consecutive time frames and following
fi gures. (b) Optical images of the (i) fi nal frame of the time-lapse video (at
22 hours 22 minutes) and (ii) brightfi eld image of the same area, postfi xation.
Note that the image of the fi xed area is rotated 22° compared with the image of
the fi nal frame such that the Matrigel–MirrIR interface is approximately vertical.
The fi xed area was analyzed by FTIR microspectroscopy and the intensity
distribution of the (iii) protein and (iv) lipid hydrocarbon domains are shown.
(v) Representative raw IR spectra taken from three locations [1 and 3 (on cell)
and 2 (on Matrigel)], from the protein intensity map, are also displayed.