
Page 28 - Vibrational Spectroscopic Imaging for Biomedical Applications
P. 28
6 Cha pte r O n e
spatial heterogeneity and connective tissue contributions when prob-
ing for disease markers in tissue spectra. While not explicitly men-
tioned, it was clear that the first step in cancer diagnoses would be to
separate the histologic units of tissue and then examine specific cell
types individually for markers of malignancy. 34,35 With the micros-
copy resolution prerequisite, the use of FT-IR microscopy for cell level
36
spectral acquisition was proposed. It is also now generally recog-
nized that univariate analysis of features, as reported in early studies,
is unlikely to provide robust measures of disease. Hence, the focus of
recent studies has been to employ microscopy approaches and multi-
37
variate spectral analyses to provide clinically relevant informa-
tion. 38,39 While the discussion above makes it clear that cell-level
spectral data is needed and multivariate analyses should be employed,
the emergence of FT-IR imaging is a critical technological develop-
ment that enables both requirements to be met. An additional need is
to demonstrate that the developed protocols are robustly applicable
to a large sample population.
1.1.3 FT-IR Imaging for Pathology
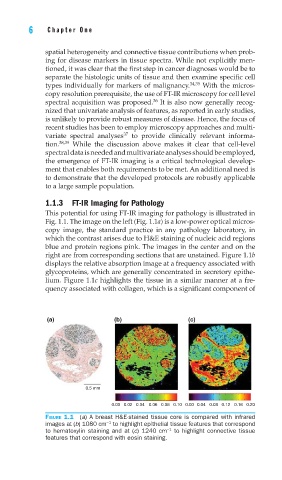
This potential for using FT-IR imaging for pathology is illustrated in
Fig. 1.1. The image on the left (Fig. 1.1a) is a low-power optical micros-
copy image, the standard practice in any pathology laboratory, in
which the contrast arises due to H&E staining of nucleic acid regions
blue and protein regions pink. The images in the center and on the
right are from corresponding sections that are unstained. Figure 1.1b
displays the relative absorption image at a frequency associated with
glycoproteins, which are generally concentrated in secretory epithe-
lium. Figure 1.1c highlights the tissue in a similar manner at a fre-
quency associated with collagen, which is a significant component of
(a) (b) (c)
0.5 mm
0.00 0.02 0.04 0.06 0.08 0.10 0.00 0.04 0.08 0.12 0.16 0.20
FIGURE 1.1 (a) A breast H&E-stained tissue core is compared with infrared
−1
images at (b) 1080 cm to highlight epithelial tissue features that correspond
−1
to hematoxylin staining and at (c) 1240 cm to highlight connective tissue
features that correspond with eosin staining.