
Page 31 - Vibrational Spectroscopic Imaging for Biomedical Applications
P. 31
0.5 mm
(c)
4000
Epithelium
Stroma
3000 3500
Wavenumber (cm –1 )
1000 1500 2000 2500
Absorbance (Offset for Clarity)
(b)
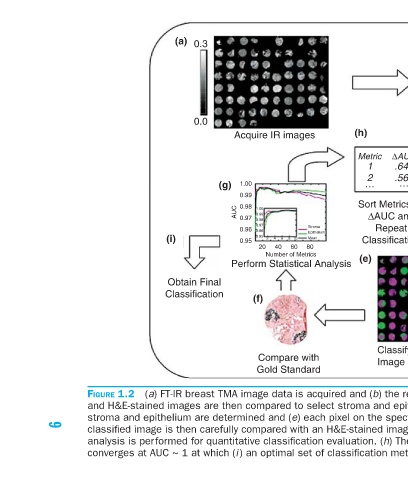
ΔAUC Select Metrics From Tissue Spectral Features .645 Select Tissue Classes .564 … Sort Metrics by ΔAUC and Repeat Classification 0.12 Stroma Epithelium 0.03 0.06 0.24 (d) 0.09 0.18 Relative Frequency 0.00 0.12 0.7 0.6 0.5 0.4 0.06 1556 cm –1 : 1652 cm –
Metric 1 2 … (e)
(h)
Acquire IR images 1.00 0.99 0.98 0.97 Stroma 0.96 Epithelium 0.95 Mean 10 8 6 4 2 80 60 40 20 Number of Metrics Perform Statistical Analysis (f) Compare with Gold Standard converges at AUC ~ 1 at which (i) an optimal set of classification metrics is selected.
(g) 1.00 0.99 0.98 AUC 0.97 0.96 0.95
0.3 0.0 Obtain Final Classification
(a)
(i)
FIGURE 1.2
9