
Page 36 - Vibrational Spectroscopic Imaging for Biomedical Applications
P. 36
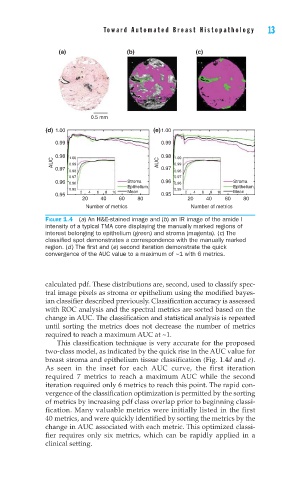
Towar d Automated Br east Histopathology   13


            (a)                (b)                (c)


                     0.5 mm
        (d)  1.00                     (e)1.00
           0.99                         0.99

          AUC 0.98  1.00               AUC 0.98 1.00
               0.99
                                            0.99
           0.97                         0.97
               0.98                         0.98
               0.97                         0.97
           0.96  0.96          Stroma   0.96 0.96           Stroma
                               Epithelium                   Epithelium
               0.95            Mean         0.95            Mean
           0.95   2  4  6  8  10        0.95   2  4  6  8  10
                   20   40   60   80           20    40   60   80
                   Number of metrics            Number of metrics
        FIGURE 1.4  (a) An H&E-stained image and (b) an IR image of the amide I
        intensity of a typical TMA core displaying the manually marked regions of
        interest belonging to epithelium (green) and stroma (magenta). (c) The
        classifi ed spot demonstrates a correspondence with the manually marked
        region. (d) The fi rst and (e) second iteration demonstrate the quick
        convergence of the AUC value to a maximum of ~1 with 6 metrics.


        calculated pdf. These distributions are, second, used to classify spec-
        tral image pixels as stroma or epithelium using the modified bayes-
        ian classifier described previously. Classification accuracy is assessed
        with ROC analysis and the spectral metrics are sorted based on the
        change in AUC. The classification and statistical analysis is repeated
        until sorting the metrics does not decrease the number of metrics
        required to reach a maximum AUC at ~1.
            This classification technique is very accurate for the proposed
        two-class model, as indicated by the quick rise in the AUC value for
        breast stroma and epithelium tissue classification (Fig. 1.4d and e).
        As  seen in the inset for each  AUC curve, the first iteration
        required 7 metrics to reach a maximum AUC while the second
        iteration required only 6 metrics to reach this point. The rapid con-
        vergence of the classification optimization is permitted by the sorting
        of metrics by increasing pdf class overlap prior to beginning classi-
        fication. Many valuable metrics were initially listed in the first
        40 metrics, and were quickly identified by sorting the metrics by the
        change in AUC associated with each metric. This optimized classi-
        fier requires only six metrics, which can be rapidly applied in a
        clinical setting.