
Page 38 - Vibrational Spectroscopic Imaging for Biomedical Applications
P. 38
Towar d Automated Br east Histopathology 15
robust metrics for tissue identification would be found in this region.
In addition, the molecular origins for these metrics involve proteins
and DNA, which are also partly responsible for epithelium and
stroma identification by H&E staining. While these six metrics were
identified as an effective classifier using the AUC optimization
method described previously, they may or may not be the best pos-
sible classifier for this calibration TMA. Some useful spectral features
initially listed toward the end in the initial metric order may not have
been adequately considered in the metric sorting process due to the
rapid convergence of the AUC value. Selection of a single optimal
classifier would require more rigorous and time consuming optimi-
zation analysis, which is not necessary for this two-class model due
to the quick AUC convergence using the simple classification itera-
tion method described in this manuscript.
1.2.4 Validation and Dependence on
Experimental Parameters
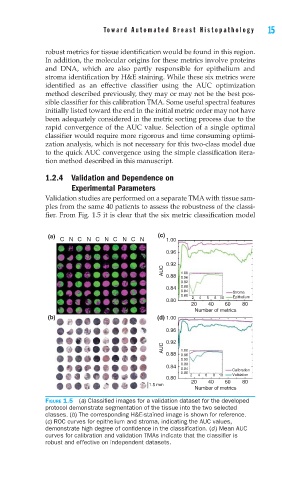
Validation studies are performed on a separate TMA with tissue sam-
ples from the same 40 patients to assess the robustness of the classi-
fier. From Fig. 1.5 it is clear that the six metric classification model
(a) (c)
C N C N C N C N C N 1.00
0.96
0.92
AUC 0.88 1.00
0.96
0.92
0.84 0.88
0.84 Stroma
0.80
0.80 2 4 6 8 10 Epithelium
20 40 60 80
Number of metrics
(b) (d) 1.00
0.96
AUC 0.92
0.88 1.00
0.96
0.92
0.88
0.84
0.84 Calibration
0.80
2 4 6 8 10 Validation
0.80
20 40 60 80
1.5 mm
Number of metrics
FIGURE 1.5 (a) Classifi ed images for a validation dataset for the developed
protocol demonstrate segmentation of the tissue into the two selected
classes. (b) The corresponding H&E-stained image is shown for reference.
(c) ROC curves for epithelium and stroma, indicating the AUC values,
demonstrate high degree of confi dence in the classifi cation. (d) Mean AUC
curves for calibration and validation TMAs indicate that the classifi er is
robust and effective on independent datasets.