
Page 42 - Vibrational Spectroscopic Imaging for Biomedical Applications
P. 42
Towar d Automated Br east Histopathology 19
(a) (b) (c)
1.0
0.8 0.8
0.8
AUC 0.6 0.6 0.6
0.4 AUC 0.4
0.8 0.8 Sensitivity 0.4
0.7 0.7
0.2 0.6 Cancer 0.2 0.6 Cancer 0.2
0.5 Normal 0.5 Normal Calibration
0.0 2 4 6 8 10 Mean 0.0 2 4 6 8 10 Mean 0.0 Validation
20 40 60 80 20 40 60 80 0.0 0.2 0.4 0.6 0.8 1.0
Number of Metrics Number of Metrics 1-Specificity
(d) (e)
(f)
0.5 mm
Cancer
Normal
CNCNCNC N C N C N C NCNCNCN
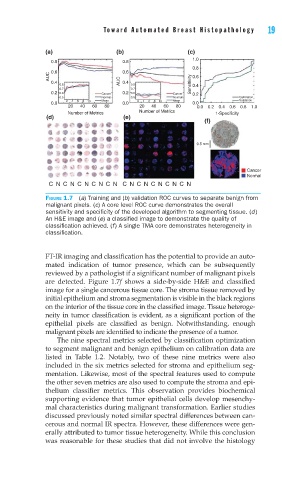
FIGURE 1.7 (a) Training and (b) validation ROC curves to separate benign from
malignant pixels. (c) A core level ROC curve demonstrates the overall
sensitivity and specifi city of the developed algorithm to segmenting tissue. (d)
An H&E image and (e) a classifi ed image to demonstrate the quality of
classifi cation achieved. (f) A single TMA core demonstrates heterogeneity in
classifi cation.
FT-IR imaging and classification has the potential to provide an auto-
mated indication of tumor presence, which can be subsequently
reviewed by a pathologist if a significant number of malignant pixels
are detected. Figure 1.7f shows a side-by-side H&E and classified
image for a single cancerous tissue core. The stroma tissue removed by
initial epithelium and stroma segmentation is visible in the black regions
on the interior of the tissue core in the classified image. Tissue heteroge-
neity in tumor classification is evident, as a significant portion of the
epithelial pixels are classified as benign. Notwithstanding, enough
malignant pixels are identified to indicate the presence of a tumor.
The nine spectral metrics selected by classification optimization
to segment malignant and benign epithelium on calibration data are
listed in Table 1.2. Notably, two of these nine metrics were also
included in the six metrics selected for stroma and epithelium seg-
mentation. Likewise, most of the spectral features used to compute
the other seven metrics are also used to compute the stroma and epi-
thelium classifier metrics. This observation provides biochemical
supporting evidence that tumor epithelial cells develop mesenchy-
mal characteristics during malignant transformation. Earlier studies
discussed previously noted similar spectral differences between can-
cerous and normal IR spectra. However, these differences were gen-
erally attributed to tumor tissue heterogeneity. While this conclusion
was reasonable for these studies that did not involve the histology