
Page 46 - Vibrational Spectroscopic Imaging for Biomedical Applications
P. 46
Towar d Automated Br east Histopathology 23
(a) Normal (b) Normal
1.0
1.0
Fraction above 50% epithelium 0.6 Fraction accurately classified 0.6
Cancer
Cancer
0.8
0.8
Cutoff
0.4
0.4
0.2
0.2
0.0
4
2
6
10
8
0.4
0.6
Square box width (pixels) 12 0.0 0.0 0.2 Offset cutoff 0.8 1.0
(c) (d)
1.0 1.0
0.9 0.9
Sensitivity 0.8 Sensitivity 0.8
0.7
0.7
0.6 0.6
Calibration Validation
0.5 0.5
0.0 0.2 0.4 0.6 0.8 1.0 0.0 0.2 0.4 0.6 0.8 1.0
1-specificity 1-specificity
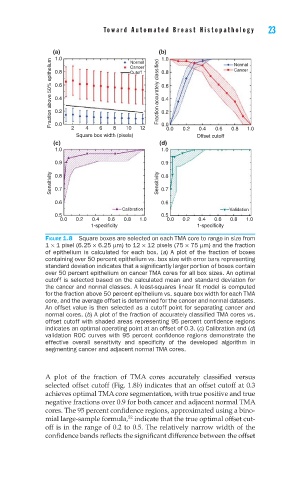
FIGURE 1.8 Square boxes are selected on each TMA core to range in size from
1 × 1 pixel (6.25 × 6.25 μm) to 12 × 12 pixels (75 × 75 μm) and the fraction
of epithelium is calculated for each box. (a) A plot of the fraction of boxes
containing over 50 percent epithelium vs. box size with error bars representing
standard deviation indicates that a signifi cantly larger portion of boxes contain
over 50 percent epithelium on cancer TMA cores for all box sizes. An optimal
cutoff is selected based on the calculated mean and standard deviation for
the cancer and normal classes. A least-squares linear fi t model is computed
for the fraction above 50 percent epithelium vs. square box width for each TMA
core, and the average offset is determined for the cancer and normal datasets.
An offset value is then selected as a cutoff point for separating cancer and
normal cores. (b) A plot of the fraction of accurately classifi ed TMA cores vs.
offset cutoff with shaded areas representing 95 percent confi dence regions
indicates an optimal operating point at an offset of 0.3. (c) Calibration and (d)
validation ROC curves with 95 percent confi dence regions demonstrate the
effective overall sensitivity and specifi city of the developed algorithm in
segmenting cancer and adjacent normal TMA cores.
A plot of the fraction of TMA cores accurately classified versus
selected offset cutoff (Fig. 1.8b) indicates that an offset cutoff at 0.3
achieves optimal TMA core segmentation, with true positive and true
negative fractions over 0.9 for both cancer and adjacent normal TMA
cores. The 95 percent confidence regions, approximated using a bino-
52
mial large-sample formula, indicate that the true optimal offset cut-
off is in the range of 0.2 to 0.5. The relatively narrow width of the
confidence bands reflects the significant difference between the offset