
Page 37 - Vibrational Spectroscopic Imaging for Biomedical Applications
P. 37
14 Cha pte r O n e
The classification accuracy is quantitatively measured against a
gold standard of tissue regions selected by a trained pathologist.
Classified images for breast TMA cores (Fig. 1.4c) are produced from
the optimal six metric classifier obtained by iteration. Qualitative
comparison of a classified image with the corresponding H&E image
from an adjacent TMA cut in Fig. 1.4a indicates a reasonable correla-
tion between classified images and H&E-stained images. These clas-
sified images and ROC analysis results indicate that FT-IR imaging
coupled with Bayesian classification has the potential to reliably
select tissue classes that correspond with H&E staining. This high-
throughput spectral classification approach that incorporates mil-
lions of spectra from many patients is the first step to establish spectral
image classification as a diagnostic tool in a clinical setting.
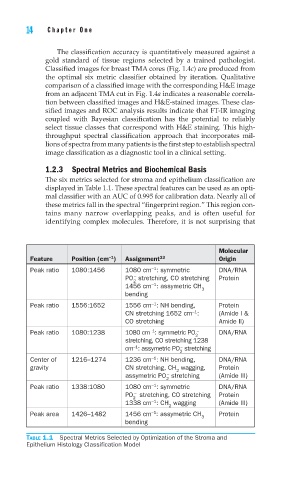
1.2.3 Spectral Metrics and Biochemical Basis
The six metrics selected for stroma and epithelium classification are
displayed in Table 1.1. These spectral features can be used as an opti-
mal classifier with an AUC of 0.995 for calibration data. Nearly all of
these metrics fall in the spectral “fingerprint region.” This region con-
tains many narrow overlapping peaks, and is often useful for
identifying complex molecules. Therefore, it is not surprising that
Molecular
-1
Feature Position (cm ) Assignment 33 Origin
Peak ratio 1080:1456 1080 cm : symmetric DNA/RNA
−1
PO stretching, CO stretching Protein
–
2
−1
1456 cm : assymetric CH
3
bending
−1
Peak ratio 1556:1652 1556 cm : NH bending, Protein
−1
CN stretching 1652 cm : (Amide I &
CO stretching Amide II)
−1
Peak ratio 1080:1238 1080 cm : symmetric PO – DNA/RNA
2
stretching, CO stretching 1238
–1
–
cm : assymetric PO stretching
2
−1
Center of 1216–1274 1236 cm : NH bending, DNA/RNA
gravity CN stretching, CH wagging, Protein
2
–
assymetric PO stretching (Amide III)
2
−1
Peak ratio 1338:1080 1080 cm : symmetric DNA/RNA
–
PO stretching, CO stretching Protein
2
−1
1338 cm : CH wagging (Amide III)
2
–1
Peak area 1426–1482 1456 cm : assymetric CH Protein
3
bending
TABLE 1.1 Spectral Metrics Selected by Optimization of the Stroma and
Epithelium Histology Classification Model