
Page 35 - Vibrational Spectroscopic Imaging for Biomedical Applications
P. 35
12 Cha pte r O n e
Stroma
Absorbance (offset for clarity)
Epithelium
1000 1500 2000 2500 3000 3500 4000
–1
Wavenumber (cm )
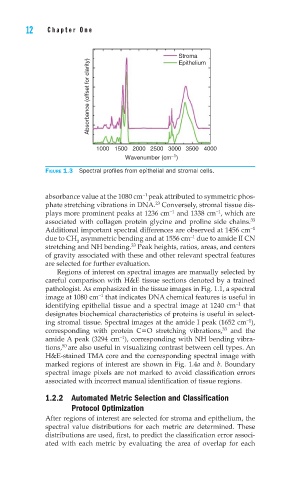
FIGURE 1.3 Spectral profi les from epithelial and stromal cells.
−1
absorbance value at the 1080 cm peak attributed to symmetric phos-
23
phate stretching vibrations in DNA. Conversely, stromal tissue dis-
−1
−1
plays more prominent peaks at 1236 cm and 1338 cm , which are
associated with collagen protein glycine and proline side chains. 33
Additional important spectral differences are observed at 1456 cm −1
−1
due to CH asymmetric bending and at 1556 cm due to amide II CN
3
33
stretching and NH bending. Peak heights, ratios, areas, and centers
of gravity associated with these and other relevant spectral features
are selected for further evaluation.
Regions of interest on spectral images are manually selected by
careful comparison with H&E tissue sections denoted by a trained
pathologist. As emphasized in the tissue images in Fig. 1.1, a spectral
−1
image at 1080 cm that indicates DNA chemical features is useful in
−1
identifying epithelial tissue and a spectral image at 1240 cm that
designates biochemical characteristics of proteins is useful in select-
−1
ing stromal tissue. Spectral images at the amide I peak (1652 cm ),
33
corresponding with protein C O stretching vibrations, and the
amide A peak (3294 cm ), corresponding with NH bending vibra-
−1
50
tions, are also useful in visualizing contrast between cell types. An
H&E-stained TMA core and the corresponding spectral image with
marked regions of interest are shown in Fig. 1.4a and b. Boundary
spectral image pixels are not marked to avoid classification errors
associated with incorrect manual identification of tissue regions.
1.2.2 Automated Metric Selection and Classification
Protocol Optimization
After regions of interest are selected for stroma and epithelium, the
spectral value distributions for each metric are determined. These
distributions are used, first, to predict the classification error associ-
ated with each metric by evaluating the area of overlap for each