
Page 282 - Vibrational Spectroscopic Imaging for Biomedical Applications
P. 282
Raman Micr oscopy for Biomedical Applications 257
1187
AFM Cantilever (a) 1519
SERS Active 1215 1567
Particle
531 798
664 909 1479
643 715 944 1002 1019 1133 1248 1295 1348 1634
Sample 1658
Microscope (A)
Objective
Excitation Scattered 1597 (B)
Laser Light 1416 1533 Raman Intensity
770 nm (b) 522 643 703 839 933 1042 1116 1175 1203 1340
(C)
1551
(A)
938 1198 1348 1419 1605
(B) 1042 1110
0 nm 525 640 700 839
(C) (D)
2 μm
(D) 600 900 1200 1500 1800
–1
Raman Shift (cm )
(c)
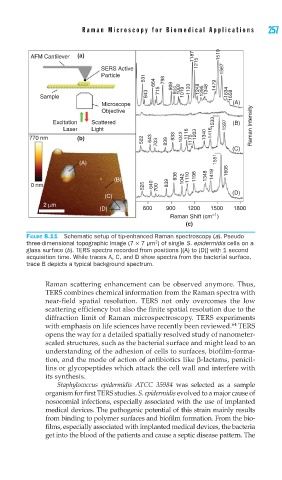
FIGURE 8.11 Schematic setup of tip-enhanced Raman spectroscopy (a). Pseudo
2
three-dimensional topographic image (7 × 7 μm ) of single S. epidermidis cells on a
glass surface (b). TERS spectra recorded from positions [(A) to (D)] with 1 second
acquisition time. While traces A, C, and D show spectra from the bacterial surface,
trace B depicts a typical background spectrum.
Raman scattering enhancement can be observed anymore. Thus,
TERS combines chemical information from the Raman spectra with
near-field spatial resolution. TERS not only overcomes the low
scattering efficiency but also the finite spatial resolution due to the
diffraction limit of Raman microspectroscopy. TERS experiments
64
with emphasis on life sciences have recently been reviewed. TERS
opens the way for a detailed spatially resolved study of nanometer-
scaled structures, such as the bacterial surface and might lead to an
understanding of the adhesion of cells to surfaces, biofilm-forma-
tion, and the mode of action of antibiotics like β-lactams, penicil-
lins or glycopeptides which attack the cell wall and interfere with
its synthesis.
Staphylococcus epidermidis ATCC 35984 was selected as a sample
organism for first TERS studies. S. epidermidis evolved to a major cause of
nosocomial infections, especially associated with the use of implanted
medical devices. The pathogenic potential of this strain mainly results
from binding to polymer surfaces and biofilm formation. From the bio-
films, especially associated with implanted medical devices, the bacteria
get into the blood of the patients and cause a septic disease pattern. The