
Page 278 - Vibrational Spectroscopic Imaging for Biomedical Applications
P. 278
254 Cha pte r Ei g h t
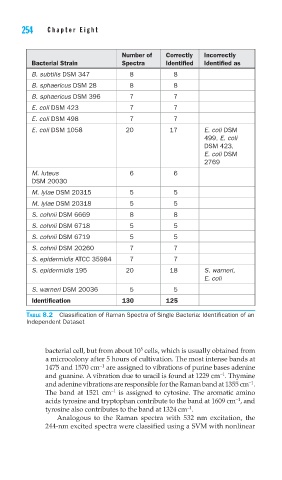
Number of Correctly Incorrectly
Bacterial Strain Spectra Identified Identified as
B. subtilis DSM 347 8 8
B. sphaericus DSM 28 8 8
B. sphaericus DSM 396 7 7
E. coli DSM 423 7 7
E. coli DSM 498 7 7
E. coli DSM 1058 20 17 E. coli DSM
499, E. coli
DSM 423,
E. coli DSM
2769
M. luteus 6 6
DSM 20030
M. lylae DSM 20315 5 5
M. lylae DSM 20318 5 5
S. cohnii DSM 6669 8 8
S. cohnii DSM 6718 5 5
S. cohnii DSM 6719 5 5
S. cohnii DSM 20260 7 7
S. epidermidis ATCC 35984 7 7
S. epidermidis 195 20 18 S. warneri,
E. coli
S. warneri DSM 20036 5 5
Identification 130 125
TABLE 8.2 Classification of Raman Spectra of Single Bacteria: Identification of an
Independent Dataset
5
bacterial cell, but from about 10 cells, which is usually obtained from
a microcolony after 5 hours of cultivation. The most intense bands at
1475 and 1570 cm are assigned to vibrations of purine bases adenine
−1
−1
and guanine. A vibration due to uracil is found at 1229 cm . Thymine
−1
and adenine vibrations are responsible for the Raman band at 1355 cm .
−1
The band at 1521 cm is assigned to cytosine. The aromatic amino
−1
acids tyrosine and tryptophan contribute to the band at 1609 cm , and
−1
tyrosine also contributes to the band at 1324 cm .
Analogous to the Raman spectra with 532 nm excitation, the
244-nm excited spectra were classified using a SVM with nonlinear