
Page 277 - Vibrational Spectroscopic Imaging for Biomedical Applications
P. 277
Raman Micr oscopy for Biomedical Applications 253
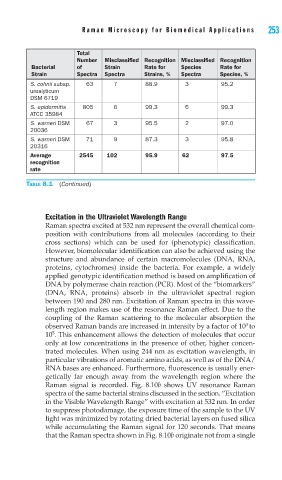
Total
Number Misclassified Recognition Misclassified Recognition
Bacterial of Strain Rate for Species Rate for
Strain Spectra Spectra Strains, % Spectra Species, %
S. cohnii subsp. 63 7 88.9 3 95.2
urealyticum
DSM 6719
S. epidermitis 805 6 99.3 6 99.3
ATCC 35984
S. warneri DSM 67 3 95.5 2 97.0
20036
S. warneri DSM 71 9 87.3 3 95.8
20316
Average 2545 102 95.9 62 97.5
recognition
rate
TABLE 8.1 (Continued)
Excitation in the Ultraviolet Wavelength Range
Raman spectra excited at 532 nm represent the overall chemical com-
position with contributions from all molecules (according to their
cross sections) which can be used for (phenotypic) classification.
However, biomolecular identification can also be achieved using the
structure and abundance of certain macromolecules (DNA, RNA,
proteins, cytochromes) inside the bacteria. For example, a widely
applied genotypic identification method is based on amplification of
DNA by polymerase chain reaction (PCR). Most of the “biomarkers”
(DNA, RNA, proteins) absorb in the ultraviolet spectral region
between 190 and 280 nm. Excitation of Raman spectra in this wave-
length region makes use of the resonance Raman effect. Due to the
coupling of the Raman scattering to the molecular absorption the
3
observed Raman bands are increased in intensity by a factor of 10 to
5
10 . This enhancement allows the detection of molecules that occur
only at low concentrations in the presence of other, higher concen-
trated molecules. When using 244 nm as excitation wavelength, in
particular vibrations of aromatic amino acids, as well as of the DNA/
RNA bases are enhanced. Furthermore, fluorescence is usually ener-
getically far enough away from the wavelength region where the
Raman signal is recorded. Fig. 8.10b shows UV resonance Raman
spectra of the same bacterial strains discussed in the section. “Excitation
in the Visible Wavelength Range” with excitation at 532 nm. In order
to suppress photodamage, the exposure time of the sample to the UV
light was minimized by rotating dried bacterial layers on fused silica
while accumulating the Raman signal for 120 seconds. That means
that the Raman spectra shown in Fig. 8.10b originate not from a single