
Page 274 - Vibrational Spectroscopic Imaging for Biomedical Applications
P. 274
250 Cha pte r Ei g h t
Raman Intensity
1000 1500 2000 2500 3000 1000 1200 1400 1600 1800
–1
–1
Raman Shift (cm ) Raman Shift (cm )
(a) (b)
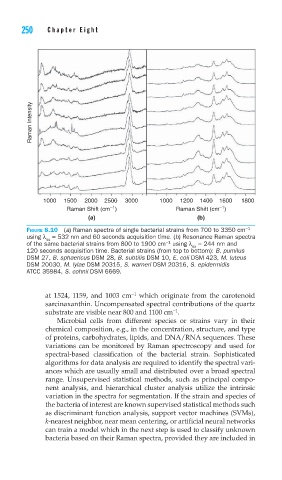
FIGURE 8.10 (a) Raman spectra of single bacterial strains from 700 to 3350 cm −1
using λ = 532 nm and 60 seconds acquisition time. (b) Resonance Raman spectra
ex
−1
of the same bacterial strains from 800 to 1900 cm using λ = 244 nm and
ex
120 seconds acquisition time. Bacterial strains (from top to bottom): B. pumilus
DSM 27, B. sphaericus DSM 28, B. subtilis DSM 10, E. coli DSM 423, M. luteus
DSM 20030, M. lylae DSM 20315, S. warneri DSM 20316, S. epidermidis
ATCC 35984, S. cohnii DSM 6669.
−1
at 1524, 1159, and 1003 cm which originate from the carotenoid
sarcinaxanthin. Uncompensated spectral contributions of the quartz
−1
substrate are visible near 800 and 1100 cm .
Microbial cells from different species or strains vary in their
chemical composition, e.g., in the concentration, structure, and type
of proteins, carbohydrates, lipids, and DNA/RNA sequences. These
variations can be monitored by Raman spectroscopy and used for
spectral-based classification of the bacterial strain. Sophisticated
algorithms for data analysis are required to identify the spectral vari-
ances which are usually small and distributed over a broad spectral
range. Unsupervised statistical methods, such as principal compo-
nent analysis, and hierarchical cluster analysis utilize the intrinsic
variation in the spectra for segmentation. If the strain and species of
the bacteria of interest are known supervised statistical methods such
as discriminant function analysis, support vector machines (SVMs),
k-nearest neighbor, near mean centering, or artificial neural networks
can train a model which in the next step is used to classify unknown
bacteria based on their Raman spectra, provided they are included in