
Page 270 - Vibrational Spectroscopic Imaging for Biomedical Applications
P. 270
246 Cha pte r Ei g h t
1557 1584 1637
1371
1396 1429 1497
1126 1584 1637
(A) 1169 1306
1371 1396 1429 1497 1557
Raman Intensity (B) 1126 1169 1306 1396 1373 1570 1629
(C) 1148 1170 1337 1431 1550 1588
969 1004 1123 1220 1305 1491
1553
1396
(D) 1148 1170 1305 1337 1429 1498
1004 1123 1220
1571 1628
900 1100 1300 1500 1700
–1
Raman Shift (cm )
(a)
−1
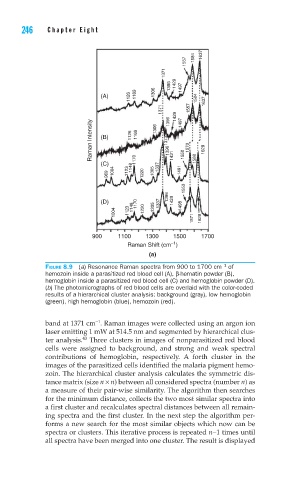
FIGURE 8.9 (a) Resonance Raman spectra from 900 to 1700 cm of
hemozoin inside a parasitized red blood cell (A), β-hematin powder (B),
hemoglobin inside a parasitized red blood cell (C) and hemoglobin powder (D).
(b) The photomicrographs of red blood cells are overlaid with the color-coded
results of a hierarchical cluster analysis: background (gray), low hemoglobin
(green), high hemoglobin (blue), hemozoin (red).
−1
band at 1371 cm . Raman images were collected using an argon ion
laser emitting 1 mW at 514.5 nm and segmented by hierarchical clus-
43
ter analysis. Three clusters in images of nonparasitized red blood
cells were assigned to background, and strong and weak spectral
contributions of hemoglobin, respectively. A forth cluster in the
images of the parasitized cells identified the malaria pigment hemo-
zoin. The hierarchical cluster analysis calculates the symmetric dis-
tance matrix (size n × n) between all considered spectra (number n) as
a measure of their pair-wise similarity. The algorithm then searches
for the minimum distance, collects the two most similar spectra into
a first cluster and recalculates spectral distances between all remain-
ing spectra and the first cluster. In the next step the algorithm per-
forms a new search for the most similar objects which now can be
spectra or clusters. This iterative process is repeated n−1 times until
all spectra have been merged into one cluster. The result is displayed