
Page 267 - Vibrational Spectroscopic Imaging for Biomedical Applications
P. 267
Raman Micr oscopy for Biomedical Applications 243
gives reasonable results under the assumption that the spectral signa-
tures within each compartment (e.g., cell nucleus) do not deviate
much. This commercial confocal Raman microscope was also applied
for single cell studies by other groups, e.g., to image liposomal drug
carrier systems. 35
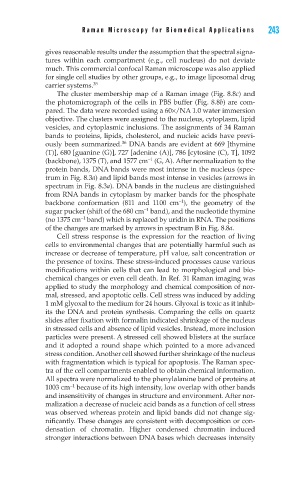
The cluster membership map of a Raman image (Fig. 8.8c) and
the photomicrograph of the cells in PBS buffer (Fig. 8.8b) are com-
pared. The data were recorded using a 60×/NA 1.0 water immersion
objective. The clusters were assigned to the nucleus, cytoplasm, lipid
vesicles, and cytoplasmic inclusions. The assignments of 34 Raman
bands to proteins, lipids, cholesterol, and nucleic acids have previ-
36
ously been summarized. DNA bands are evident at 669 [thymine
(T)], 680 [guanine (G)], 727 [adenine (A)], 786 [cytosine (C), T], 1092
−1
(backbone), 1375 (T), and 1577 cm (G, A). After normalization to the
protein bands, DNA bands were most intense in the nucleus (spec-
trum in Fig. 8.3a) and lipid bands most intense in vesicles (arrows in
spectrum in Fig. 8.3a). DNA bands in the nucleus are distinguished
from RNA bands in cytoplasm by marker bands for the phosphate
−1
backbone conformation (811 and 1100 cm ), the geometry of the
−1
sugar pucker (shift of the 680 cm band), and the nucleotide thymine
−1
(no 1375 cm band) which is replaced by uridin in RNA. The positions
of the changes are marked by arrows in spectrum B in Fig. 8.8a.
Cell stress response is the expression for the reaction of living
cells to environmental changes that are potentially harmful such as
increase or decrease of temperature, pH value, salt concentration or
the presence of toxins. These stress-induced processes cause various
modifications within cells that can lead to morphological and bio-
chemical changes or even cell death. In Ref. 31 Raman imaging was
applied to study the morphology and chemical composition of nor-
mal, stressed, and apoptotic cells. Cell stress was induced by adding
1 mM glyoxal to the medium for 24 hours. Glyoxal is toxic as it inhib-
its the DNA and protein synthesis. Comparing the cells on quartz
slides after fixation with formalin indicated shrinkage of the nucleus
in stressed cells and absence of lipid vesicles. Instead, more inclusion
particles were present. A stressed cell showed blisters at the surface
and it adopted a round shape which pointed to a more advanced
stress condition. Another cell showed further shrinkage of the nucleus
with fragmentation which is typical for apoptosis. The Raman spec-
tra of the cell compartments enabled to obtain chemical information.
All spectra were normalized to the phenylalanine band of proteins at
−1
1003 cm because of its high intensity, low overlap with other bands
and insensitivity of changes in structure and environment. After nor-
malization a decrease of nucleic acid bands as a function of cell stress
was observed whereas protein and lipid bands did not change sig-
nificantly. These changes are consistent with decomposition or con-
densation of chromatin. Higher condensed chromatin induced
stronger interactions between DNA bases which decreases intensity